前言
基于echarts5.x和vue2实现
记录以便日后查阅
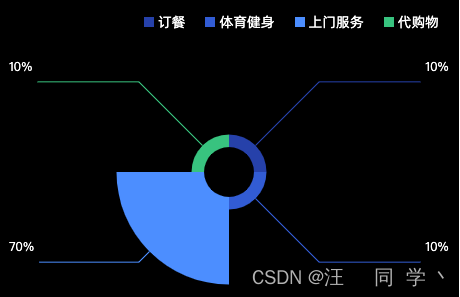
实现效果
代码实现
<template>
<div class="chart-wrap">
<ul class="legend-list">
<li
v-for="(item, index) in legend"
:key="index"
:class="['legend', item.selected ? '': 'un-active']"
@mouseenter="enterHandler(item)"
@mouseleave="leaveHandler(item)"
@click="clickHandler(item)"
>
<i class="rect" :style="{ backgroundColor: item.color }" />
<span>{{ item.title }}</span>
</li>
</ul>
<div id="chart02" class="chart" />
</div>
</template>
<script>
export default {
name: 'Index',
data () {
return {
chart: null,
data: [10, 10, 70, 10],
legend: [
{ color: 'rgba(0, 80, 179, 1)', title: '订餐', selected: true },
{ color: 'rgba(9, 109, 217, 1)', title: '体育健身', selected: true },
{ color: 'rgba(51, 157, 255, 1)', title: '上门服务', selected: true },
{ color: 'rgba(6, 200, 140, 1)', title: '代购物', selected: true }
]
}
},
mounted() {
this.createChartHandler()
},
methods: {
createChartHandler () {
this.chart = this.$echarts.init(document.getElementById('chart02'))
this.chart.setOption(this.getChartOption(this.data, this.legend))
window.addEventListener('resize', () => {
setTimeout(() => {
this.chart.resize()
})
})
},
getChartOption (data, legend) {
return {
tooltip: {
trigger: 'item',
position: 'right',
extraCssText:
'color:#fff;background: rgba(0, 38, 118, 0.5);border:none; box-shadow: 0px 0px 8px 1px rgba(0, 145, 255, 0.5);border-radius: 2px;z-index:99',
formatter: function (e) {
return e.data.name + ': ' + e.data.value
}
},
legend: {
show: false,
data: legend.map(i => i.title)
},
color: legend.map(i => i.color),
series: [
{
type: 'pie',
radius: ['20%', '90%'],
center: ['50%', '50%'],
label: {
alignTo: 'edge',
formatter: '{name|{d}%}\n',
minMargin: 5,
edgeDistance: 10,
lineHeight: 30,
rich: {
name: {
fontSize: 12,
color: '#fff',
fontFamily: 'PingFangReg',
fontWeight: '400'
}
}
},
roseType: 'area',
data: [
{ value: data[0], name: '订餐' },
{ value: data[1], name: '体育健身' },
{ value: data[2], name: '上门服务' },
{ value: data[3], name: '代购物' }
]
}
]
}
},
enterHandler (item) {
if (!this.chart) return
this.chart.dispatchAction({
type: 'highlight',
name: item.title
})
},
leaveHandler (item) {
if (!this.chart) return
this.chart.dispatchAction({
type: 'downplay',
name: item.title
})
},
clickHandler (item) {
if (!this.chart) return
item.selected = !item.selected
this.chart.dispatchAction({
type: 'legendToggleSelect',
name: item.title
})
}
}
}
</script>


 6269
6269

 被折叠的 条评论
为什么被折叠?
被折叠的 条评论
为什么被折叠?
 到【灌水乐园】发言


