


 本文详细介绍如何通过ELK堆栈收集nginx及Apache服务器的日志,并在Kibana中进行展示。具体步骤包括服务器软件的安装配置、日志格式化、logstash配置以及最终的数据展示。
说明:此篇在elk系列之elk单机部署(https://blog.youkuaiyun.com/weixin_44320761/article/details/121333670)的基础上操作。将nginx、apache等日志通过logstash收集,在Kibana前台展示。
1、nginx安装
(1)安装依赖
yum install -y gcc-c++
yum install -y pcre pcre-devel
yum install -y zlib zlib-devel
yum install -y openssl openssl-devel
(2)下载nginx
cd /usr/local
wget -c https://nginx.org/download/nginx-1.12.1.tar.gz
(3)解压编译安装
tar xvf nginx-1.12.1.tar.gz
cd nginx-1.12.1
./configure
make
make install
2、nginx配置
log_format json '{"@timestamp":"$time_iso8601",'
             '"@version":"1",'
             '"client":"$remote_addr",'
             '"url":"$uri",'
             '"status":"$status",'
             '"domian":"$host",'
             '"host":"$server_addr",'
             '"size":"$body_bytes_sent",'
             '"responsetime":"$request_time",'
             '"referer":"$http_referer",'
             '"ua":"$http_user_agent"'
          '}';
access_log的输出格式为刚才定义的json
access_log  logs/elk.access.log  json;
3、启动nginx
cd /usr/local/nginx/sbin
./nginx
4、apache安装
yum install httpd -y
5、apache配置
LogFormat "{ \
        \"@timestamp\": \"%{%Y-%m-%dT%H:%M:%S%z}t\", \
        \"@version\": \"1\", \
        \"tags\":[\"apache\"], \
        \"message\": \"%h %l %u %t \\\"%r\\\" %>s %b\", \
        \"clientip\": \"%a\", \
        \"duration\": %D, \
        \"status\": %>s, \
        \"request\": \"%U%q\", \
        \"urlpath\": \"%U\", \
        \"urlquery\": \"%q\", \
        \"bytes\": %B, \
        \"method\": \"%m\", \
        \"site\": \"%{Host}i\", \
        \"referer\": \"%{Referer}i\", \
        \"useragent\": \"%{User-agent}i\" \
       }" apache_json
修改输出格式为上面定义的json格式
CustomLog "logs/access_log" apache_json
6、启动apache
systemctl start httpd
7、vim /etc/logstash/conf.d/logstash.conf
添加如下:
file {
    path => "/var/log/httpd/access_log"
    type => "http"
    start_position => "beginning"
}

file {
    path => "/usr/local/nginx/logs/elk.access.log"
    type => "nginx"
    start_position => "beginning"
}


if [type] == "http" {
    elasticsearch {
        hosts => ["10.1.0.103:9200"]
        index => "test-http-%{+YYYY.MM.dd}"
    }
}

if [type] == "nginx" {

    elasticsearch {
        hosts => ["10.1.0.103:9200"]
        index => "test-nginx-%{+YYYY.MM.dd}"
    }
}
8、重启logstash
nohup logstash -f logstash.conf > /dev/null 2>&1
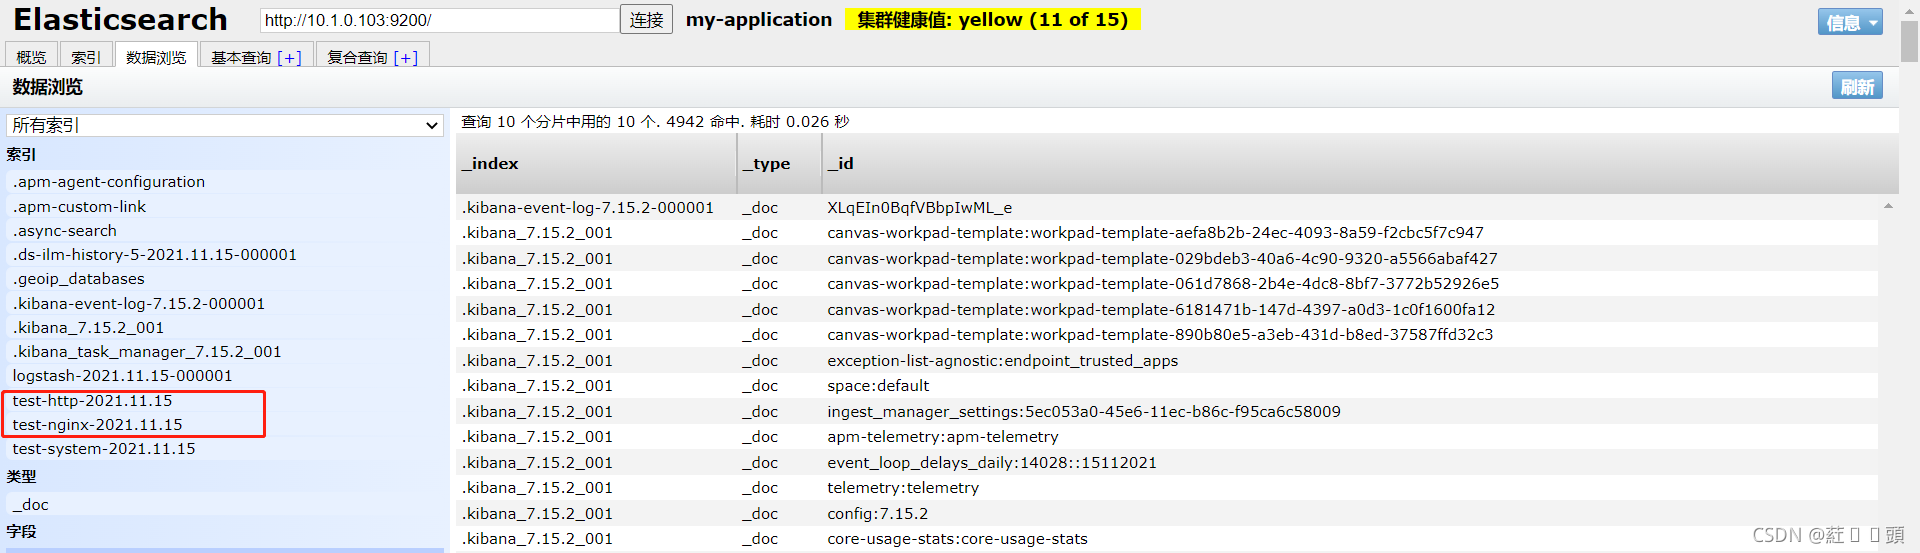
9、查看结果
1图为elasticsearch-head查看的结果
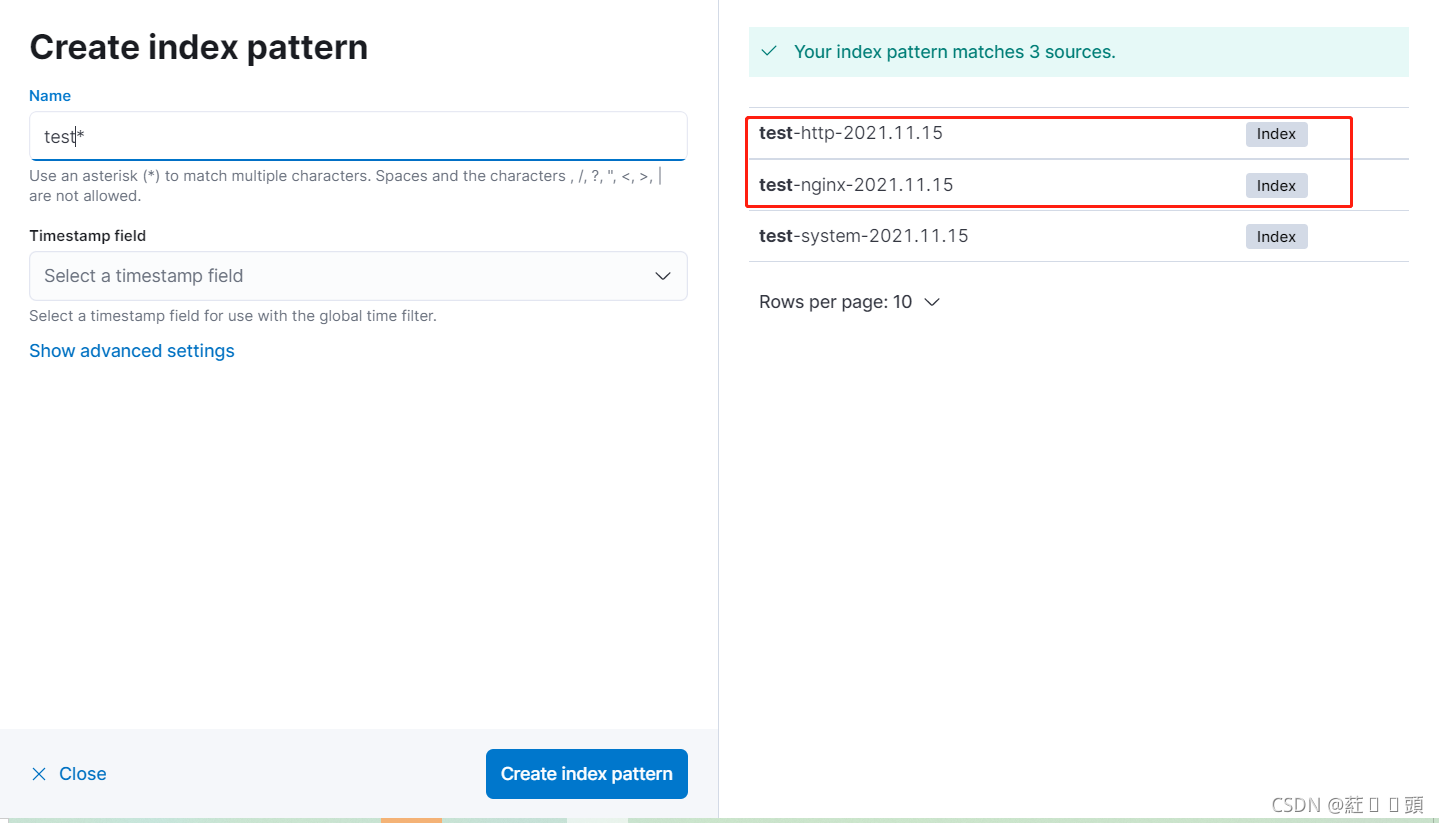
2图为添加index时的结果
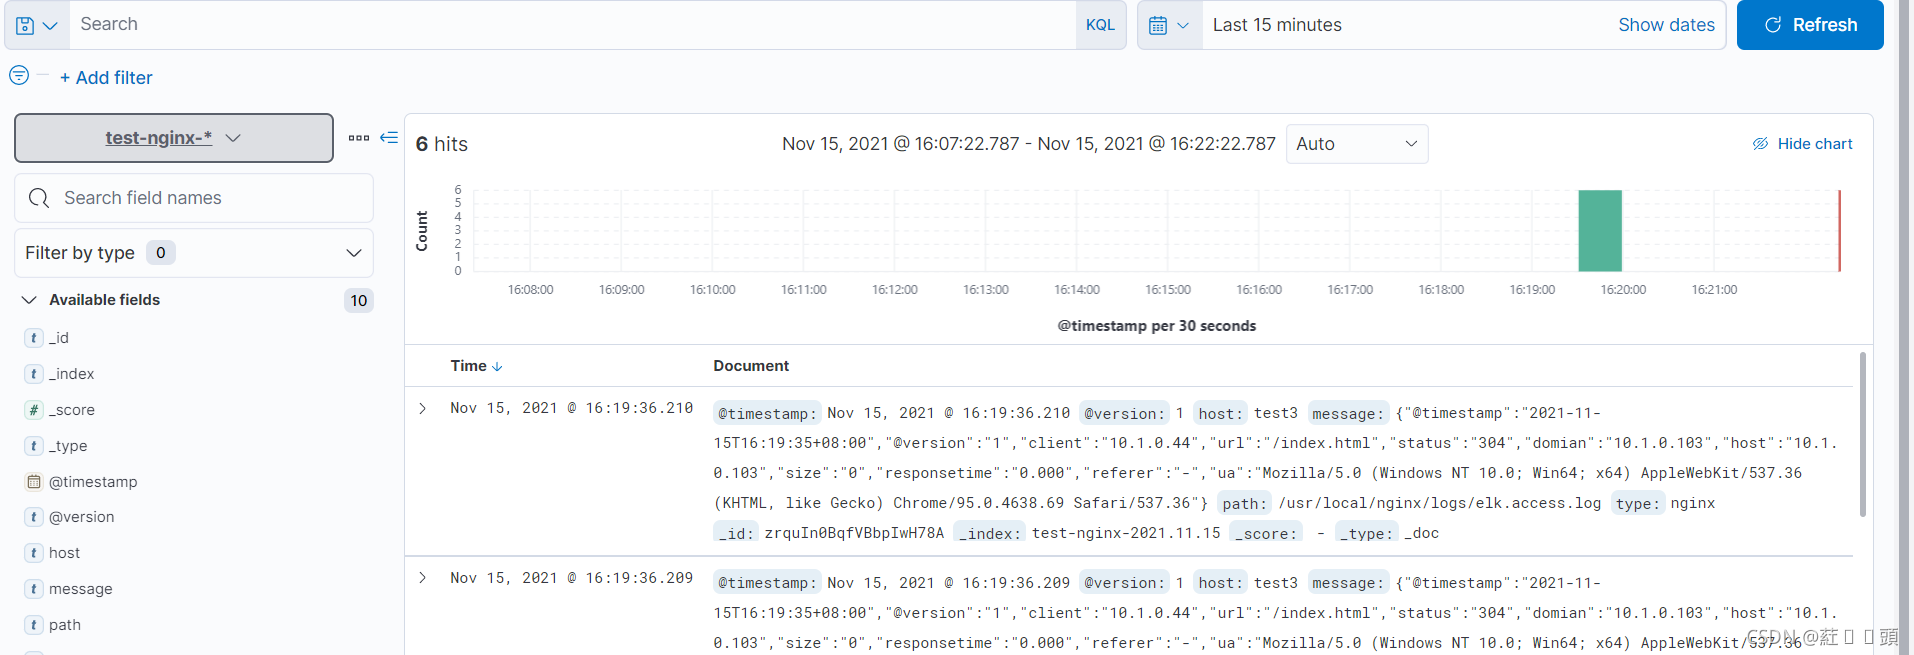
3图为在页面查看到的日志


 2018
2018

 被折叠的 条评论
为什么被折叠?
被折叠的 条评论
为什么被折叠?
 到【灌水乐园】发言


