


置信区间(Confidence Interval, CI)
- 统计学意义
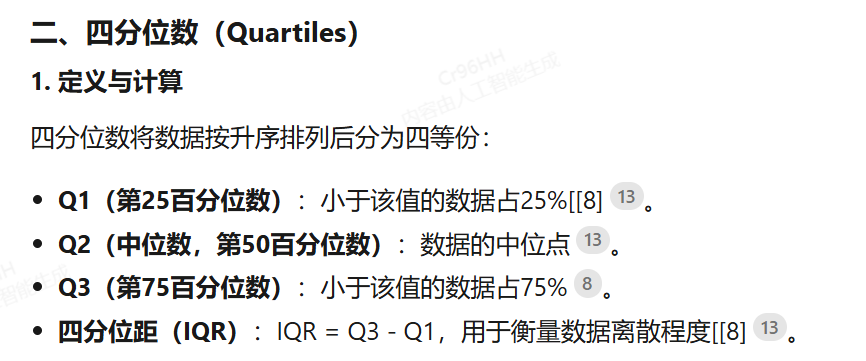
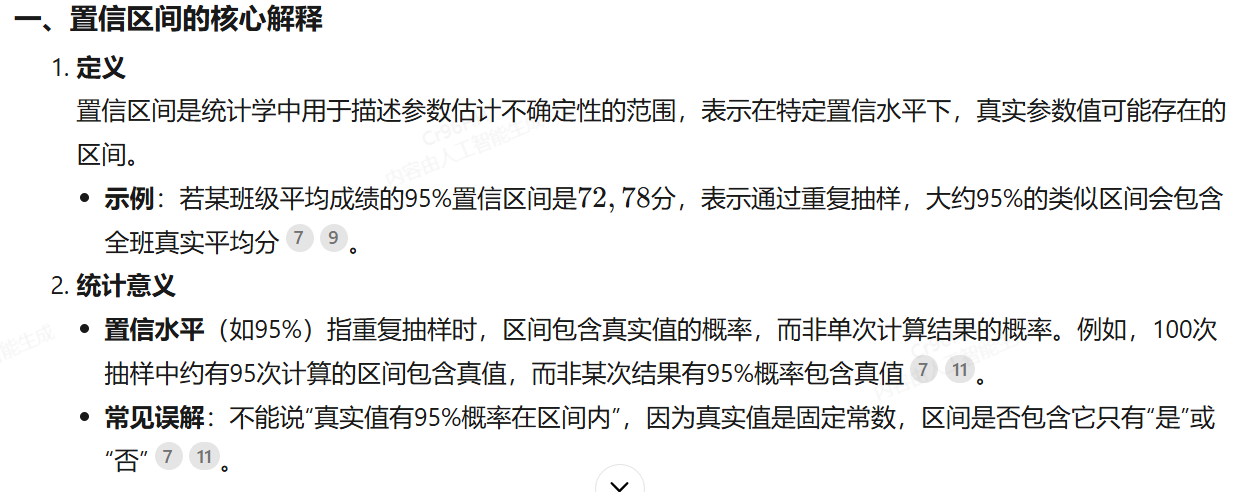
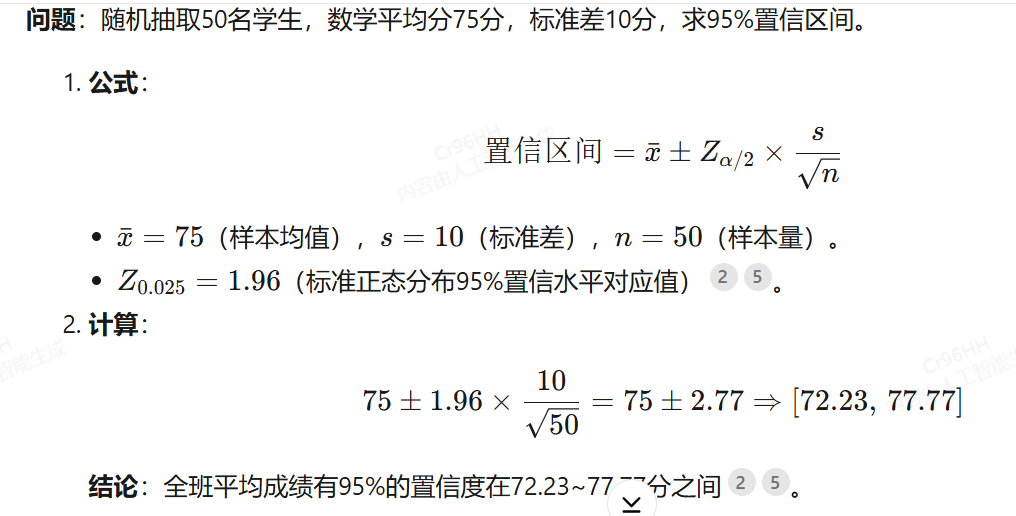
置信区间是参数估计的区间范围,表示真实值以一定概率(如95%)落入该区间。
使用 XGBoost 进行 分位数回归(Quantile Regression) 并计算 置信区间(Confidence Interval) 是一种在回归任务中预测目标变量分布特定分位数的方法,相较于传统的均值回归,它能提供更全面的预测分布信息。
import numpy as np
import pandas as pd
import xgboost as xgb
from sklearn.datasets import fetch_california_housing
from sklearn.model_selection import train_test_split
from sklearn.metrics import mean_squared_error
import matplotlib.pyplot as plt

#定义分位数参数
QUANTILES = [0.05, 0.5, 0.95]  # 5%分位数、中位数、95%分位数
#存储不同分位数的模型
models_preds = {}
#训练分位数回归模型
for q in QUANTILES:
    print(f"Training model for quantile {q:.2f}")
    model = xgb.XGBRegressor(
        objective='reg:quantileerror',  # 分位数损失函数
        quantile_alpha=q,              # 指定分位数值
        n_estimators=150,
        learning_rate=0.05,
        max_depth=3,
        subsample=0.8,
        colsample_bytree=0.8,
        random_state=42
    )
    model.fit(trainX, trainY)
    models_preds[f'q_{q}'] = model

#生成概率预测
preds = {}
for q_name, model in models_preds.items():
    preds[q_name] = model.predict(testX)

#计算预测区间覆盖率
coverage = np.mean((testY >= preds['q_0.05']) & (testY <= preds['q_0.95']))
interval_width = np.mean(preds['q_0.95'] - preds['q_0.05'])

#评估指标
mse = mean_squared_error(testY, preds['q_0.5'])
print(f"\nMedian Prediction MSE: {mse:.4f}")
print(f"90% Prediction Interval Coverage: {coverage*100:.1f}%")
print(f"Average Interval Width: {interval_width:.2f}")

#可视化预测区间(取前50个样本)
plt.figure(figsize=(12,6))
plt.plot(preds['q_0.5'][:50], 'bo-', label='Median Prediction')
plt.fill_between(range(50),
                 preds['q_0.05'][:50],
                 preds['q_0.95'][:50],
                 color='gray', alpha=0.3, label='90% Prediction Interval')
plt.plot(testY[:50], 'r*-', label='True Values')
plt.title('XGBoost Quantile Regression Predictions')
plt.xlabel('Sample Index')
plt.ylabel('House Price')
plt.legend()
plt.show()


 1304
1304

 被折叠的 条评论
为什么被折叠?
被折叠的 条评论
为什么被折叠?
 到【灌水乐园】发言


