


 本文分享了2020年“东方国信杯”高校大数据开发大赛第三名团队的思路,介绍了面对5G用户识别的挑战,如何通过特征工程、模型选择与优化,以及自动化特征筛选策略,构建高效预测模型。
2020“东方国信杯”高校大数据开发大赛最终榜第三名思路分享
2020“东方国信杯”高校大数据开发大赛刚刚结束,我所在的队伍“三人运动团”最后取得了3/453 这个还算不错的成绩。感谢两位大佬队友的一路相伴!!下面我将分享一下我们本次比赛的一点思路!
写在前面:大家好!我是练习时长半年的在读本科生数据小白JerryX,各位数据挖掘大佬有什么问题和建议多多指教!!欢迎大家多多点赞,多多评论,多多批评指正!!
0 赛题背景

随着信息化浪潮的发展,我们即将迎来5G时代的浪潮,而中国也是5G通信时代的引领者。
去年十月,三大电信运营商共同宣布5G商用服务启动,发布相应的5G套餐,席卷全球的5G浪潮正式走进中国的千家万户。
5G使云服务进一步往边缘发展,越来越多的边缘算力将促进基于边缘计算的AI应用,更低的网络延时,
也使得终端和云对AI计算的分工更为灵活。无人驾驶、智能家居、工业物联将快速发展。
而对于通信运营商来说,如何基于 一些用户侧的信息进行用户画像,
再进一步对于潜在的5G使用者进行精准的推销也是非常有帮助的。
而这个也正是本次东方国信杯的比赛目标。

本次竞赛提供已经转向5G的用户以及尚未转向5G用户的各种数据,要求通过建模识别5G潜在用户。参赛者通过构建预测模型,预测待测试数据中用户在下个月是否会转化为5G用户。可以初步将本次比赛建模为一个结构化列表数据的二分类预测问题。本次比赛的评价指标为F1-score,为了优化这个目标评价函数,我们在后续的模型训练过程中要同时考虑召回率和准确率的权衡,同时我们也要考虑到如何最低化F1score的敏感性的对于预测结果的影响。
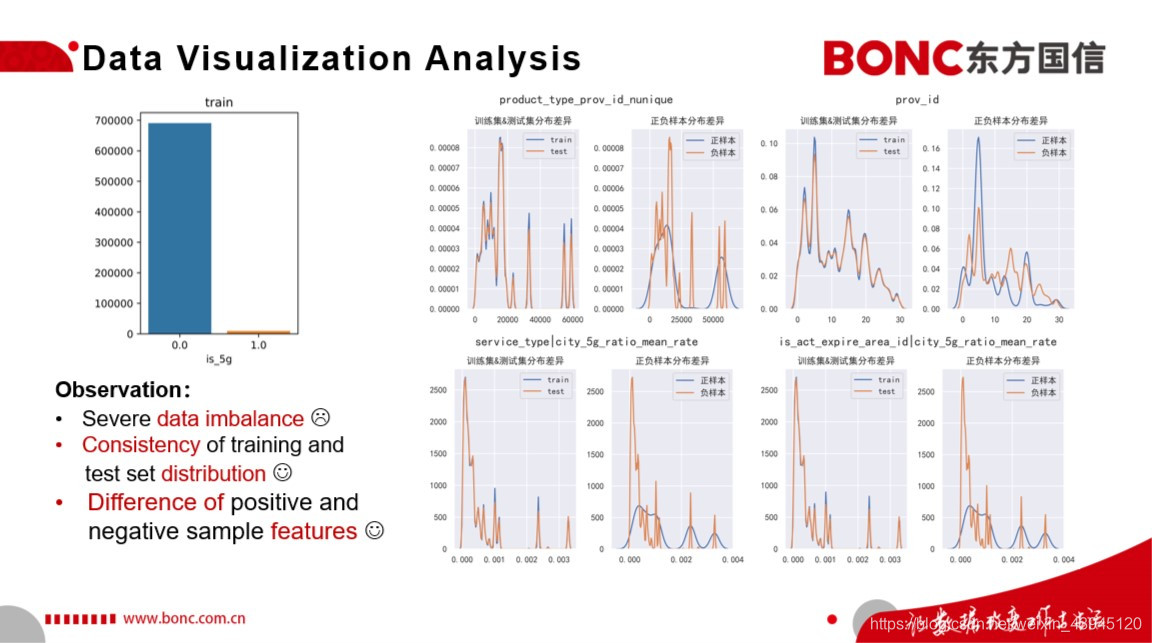
通过对于本次比赛数据集的简单探索性可视化分析,我们可以从左图中70W条的训练集数据的标签分布得知本次比赛的正负样本具有非常严重的不平衡问题,这是我们后续建模过程中需要考虑的问题。同时我们通过对于部分特征进行训练集测试集分布的可视化,可以发现训练集和测试集的分布一致性比较好,这就意味着在本次比赛中数据分布迁移并不是我们所要面临的问题。此外,我们通过对于训练集样本中的 正负样本的分布进行可视化,可以直观的看到其实正负样本在某些特征的分布上具有这一些显著的差异,这对于我们模型的准确分类奠定了良好的基础。
1 特征工程
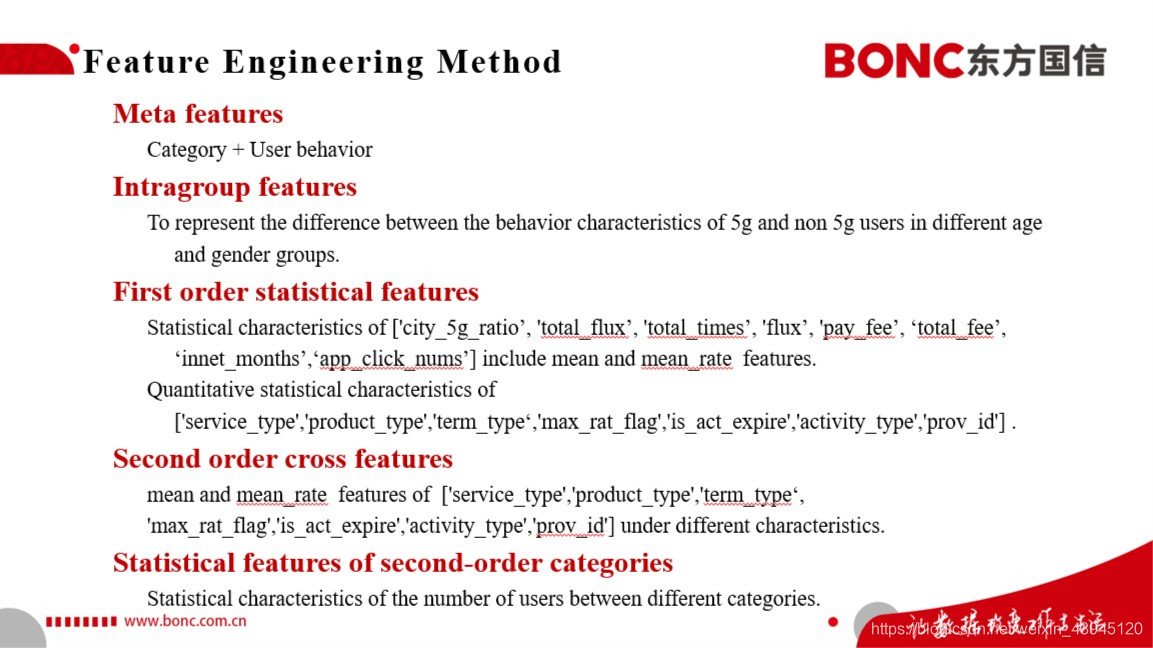
我们在本次比赛中主要使用了以下的5类特征,包括原始的特征、我们基于人工经验构造的基于不同年龄和性别分组的组内行为的统计特征。一阶的统计特征:包括一些均值、百分位等特征。以及二阶的交叉特征和一些二阶的统计交叉特征。
在其中,一部分的特征我们是通过对于数据分布的观察分析、并结合实际业务和自己的经验进行构造;
另一部分的特征我们采用了Auto-ML的方法进行自动化的特征交叉构建与自动化的特征筛选。同时结合了人工构造特征的经验性和自动特征工程的高效便捷的特性。

在自动化特征构造部分,我们采用的部分特征的自动化构造方式如左图所示。 我们首先会将特征按照他们的属性:比如按照资费、APP软件资费使用量等类进行分组,这一点是考虑到一些特征的大类目间进行运算是不具有实际意义的,那么这样的特征即便在训练集上对于正负样本具有很好的区分意义,也会带来潜在很大的后续模型过拟合的风险。接着我们就会利用一些加减乘除的操作,对于特征对进行自动的特征构造,同时利用树模型对于每一轮构造出的特征的重要性进行排序,把前topK%的特征保留下来进一步作为我们的特征组。这个自动化构造的方法可以对于此类交叉特征的构造有着很好的帮助,兼具着普适性和高效性的特点。
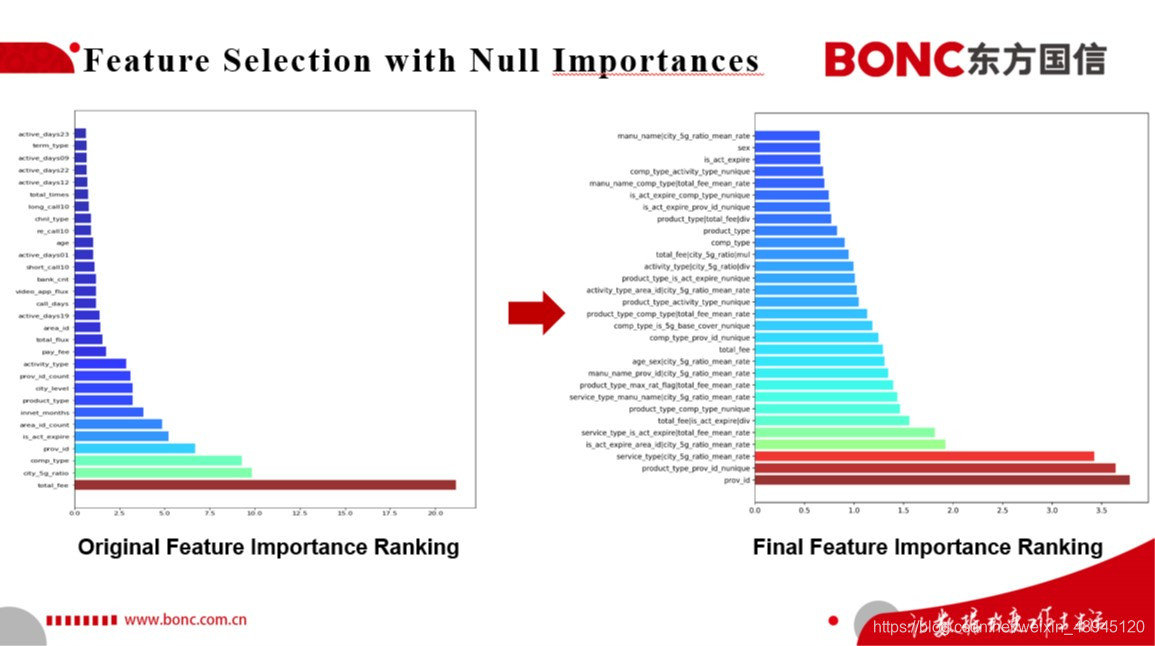
这里所展示的是我们原始数据集上的特征重要性排名与我们构造完毕的特征集上的特征重要性排名,可以发现我们构造的很多新的交叉组合特征在新的模型中起到了比较重要的作用。
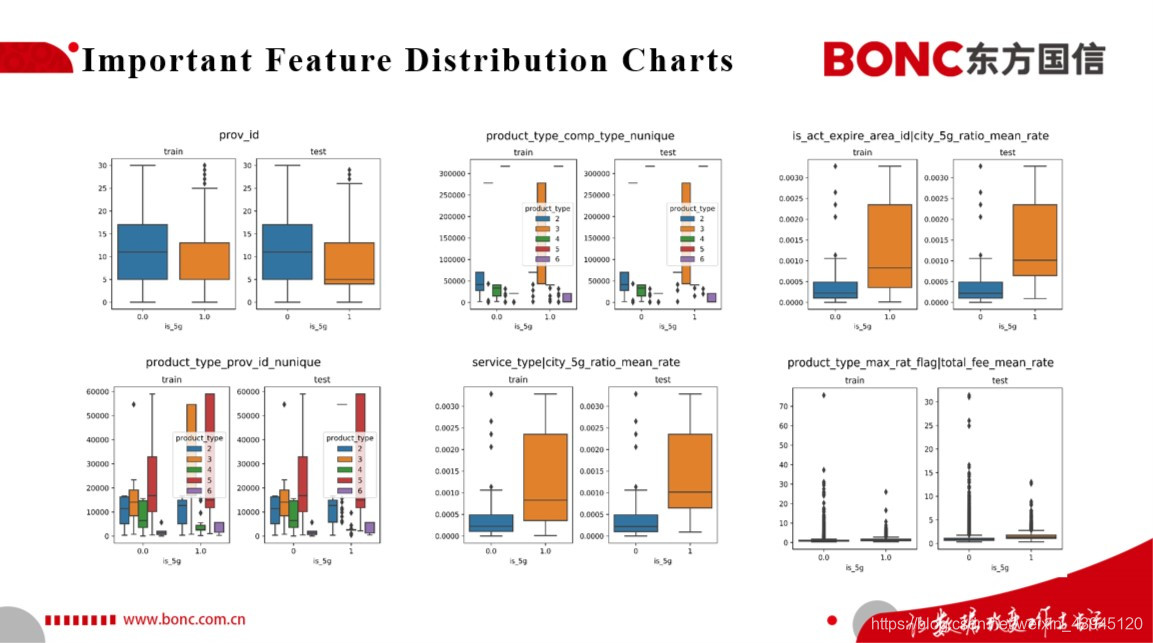
以上选取的是我们基于树模型进行特征重要性排序后得到的部分重要特征在正负样本上分布的箱式图, 可以看出我们基于树模型特征重要性排序得到的原始的重要特征与我们基于特征工程构造的高阶组合特征的正负样本分布都具有一定的差异性,这就表明我们可以基于这些我们构造的特征为后续潜在5G用户的识别从数据特征方面打下一个良好的基础。
2 模型策略
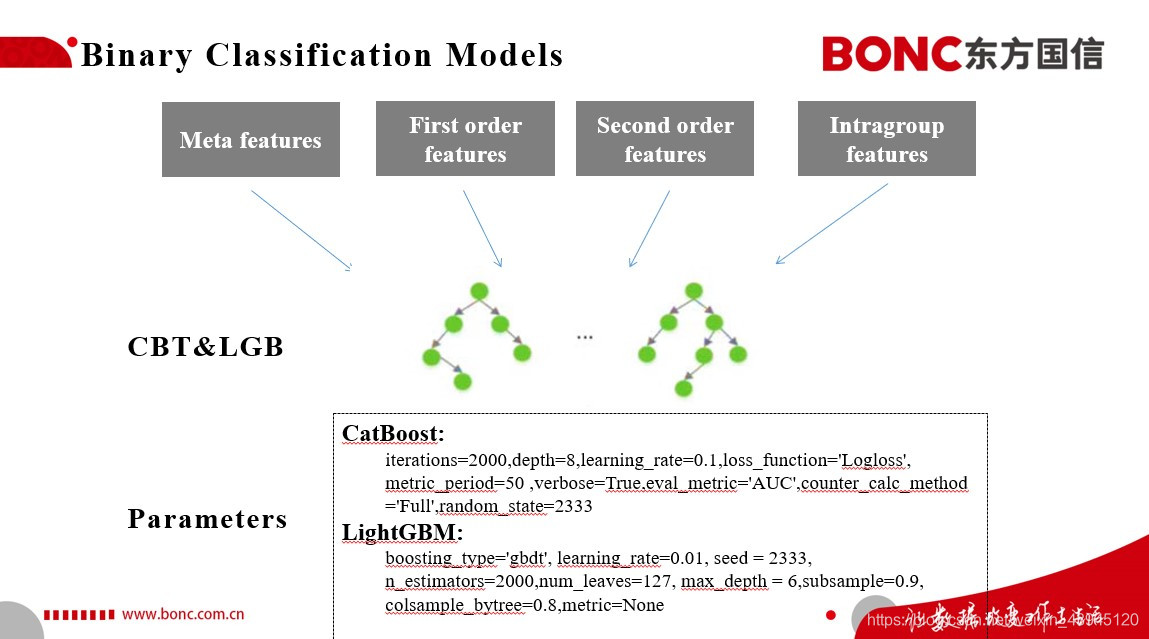
本次比赛我们考虑到实际业务对于可解释性的需求,便采用了一个非常简洁且高效的建模方法,就是结合Catboost和LightGBM来进行二分类的模型构建。 我们将我们前面特征工程构建的特征集喂给以上的两个模型,来对于测试集上的用户进行是否会在下个月转化为5G用户这个问题进行二分类。在模型参数上,我们并没有进行过多的调参,而是采用了5折的思路,尽可能地提高我们模型的鲁棒性。
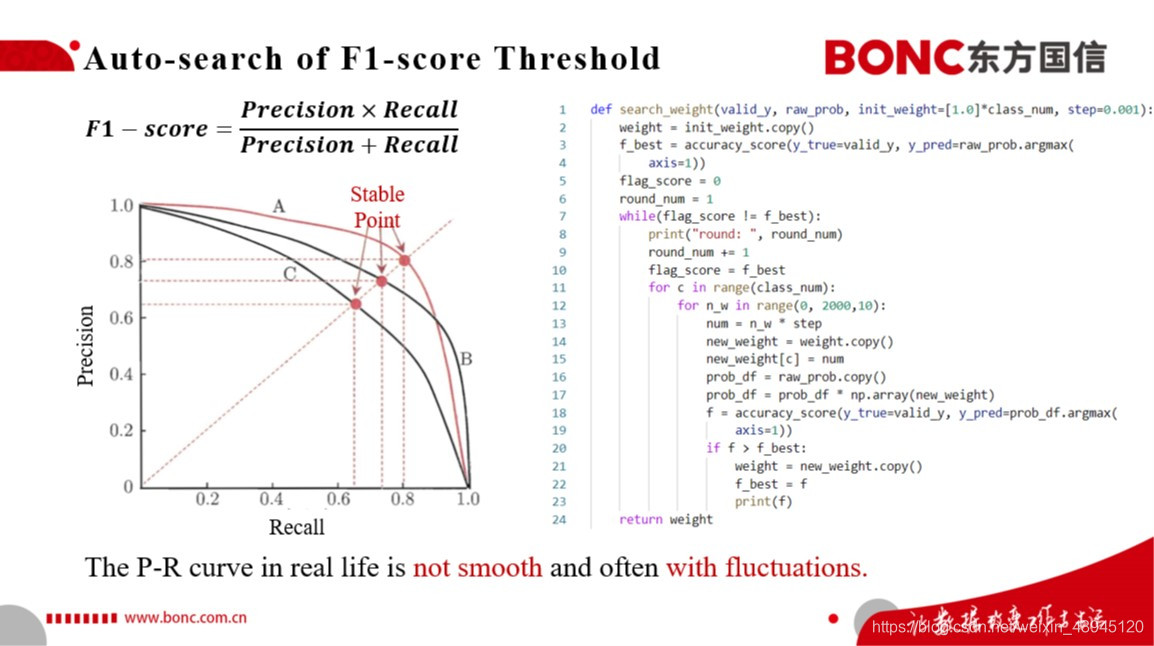
同时我们通过左图的Precision-Recall的P-R曲线中,可以得知这里的stable point便是我们所要求的F1-score的最大值所在点。但是实际模型P-R曲线的并不会像左图这样光滑,它是会带有很多的抖动的。那么我们就需要考虑结合训练集模型预测结果对于模型预测结果的阈值进行一定的阈值自动搜索,来得到一个好的阈值,以优化我们在测试集上的f1-score这一指标。
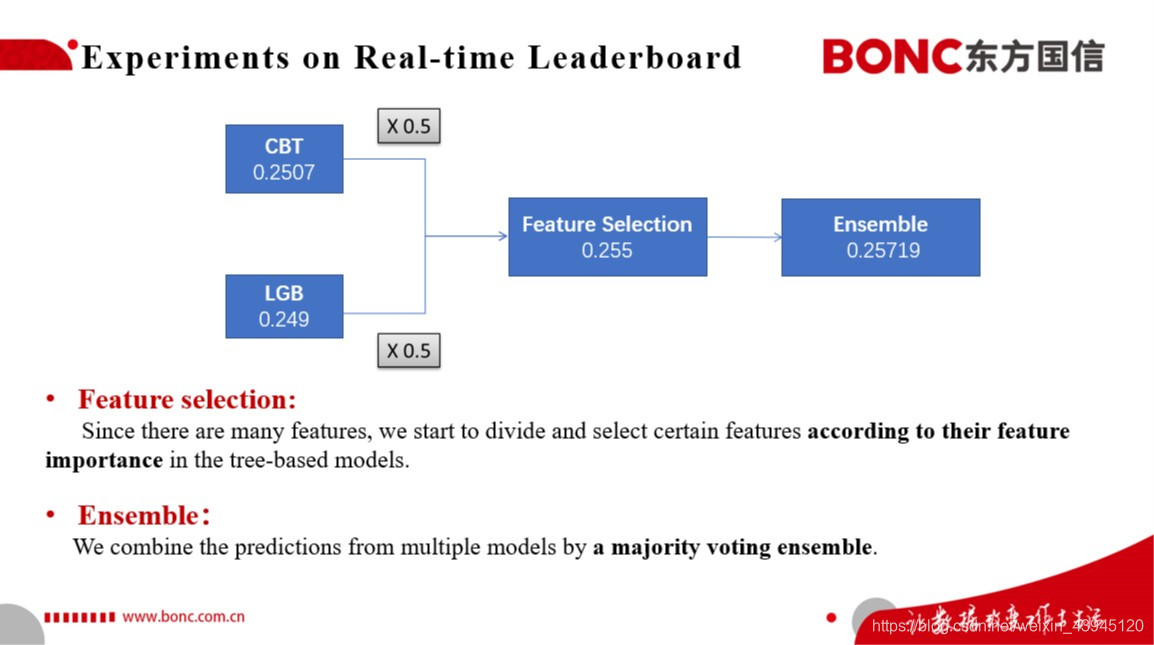
结合以上我们的建模思路,我们在实时榜上进行了一定的实验,我们最终考虑采用Catboost、LightGBM输出预测结果进行平均融合,并结合以上两个树模型进行特征的筛选和迭代训练。我们在实时榜上因而取得了0.255的最佳单模的成绩,同时在对于多个单模基于Majority Voting的Ensemble策略进行融合,得到了我们最终实时榜上的分数0.25719.
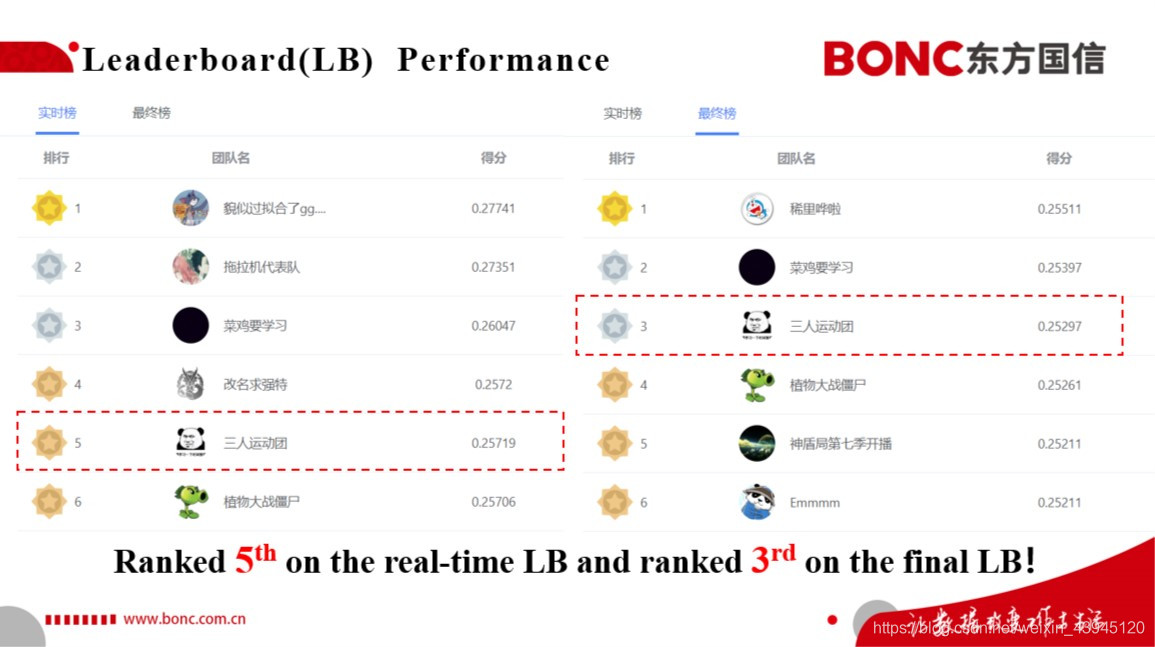
这里展示的是我们本次比赛的实时榜和最终榜上的得分和排名。我们在实时榜上取得了第五名的成绩,同时在最终榜上取得了第三名的好成绩。可以看出来我们的模型成绩在AB榜单上的表现是非常稳定的。进一步说明了我们整个特征选取和建模思路的鲁棒性。
3 结论&展望

我们最终的比赛解决方案总结如下:
首先,我们的特征工程充分利用了手工构造特征和自动化特征构造的优点。
其次,我们基于树模型对于特征重要性的排名,设计了一种鲁棒且高效的自动特征筛选策略,这使得我们后续模型的过拟合风险降到最低。
然后,就是在建模阶段,我们基于Catboost和LightGBM进行了二分类模型的构建,同时进行了majority voting ensemble,实现了一种简单而有效的方法。
最后,我们基于自动化的F1-score的搜索策略,尽可能地降低该指标敏感性对于模型预测结果的影响。

结合这次比赛和通讯技术的发展规律,我来讲讲对于5G潜在用户识别这一比赛的一点思考和展望。我们结合过去2G/3G/4G的发展,我们可以推断在经历了过去几年4G技术从兴起到主宰了,到现在5G技术的兴起,在不久的将来我们的社会也会经历从5G的兴起到5G主宰移动通讯方式的发展阶段。因此,我们可以想见的是,我们的潜在的5G用户的识别建模问题也会随着时间的演变,面临着训练集与测试集分布不一致的问题,也就是特征迁移与模型老化的问题。那么,如何去解决这样真实世界中开放动态的环境中数据分布变化的问题,就是我们要进一步思考的问题了,我想这对于实际的5G用户识别的线上实际部署将是一个非常大的挑战。

最后,我代表我们的团队,对于本次比赛的主办方东方国信公司的老师和图灵联邦竞赛平台的工作人员表达诚挚的感谢。感谢老师们过去培训阶段充满干货的课程,也感谢能够提供这样一次比赛机会,让我们深入去思考电信运营商所需要面临和解决的实际问题,同时更进一步的去思考在我们不久的未来,5G浪潮将给我们的生活方方面面所将带来的深远影响!
附录1:部分手工构造特征代码
#基于用户年龄段和省份进统计特征的构建
for col in ['innet_months','total_flux','total_fee','pay_fee','call_days','re_call10','short_call10','long_call10','bank_cnt',
         'game_app_flux','live_app_flux','video_app_flux']:
        group_df = df.groupby(['age','sex','prov_id'])[col].agg({col+'_MEAN': 'mean',
                                                         col+'_MAX': 'max',
                                                         col+'_MIN': 'min',
                                                         col+'_STD': 'std',
                                                         col+'_SKEW': 'skew',
                                                         col+'_MED': 'median',
                                                         col+'_nunique': 'nunique'}).reset_index()
        group_df[col+'_PTP'] = group_df[col+'_MAX'] - group_df[col+'_MIN']
        group_df[col+'_max_mean'] = group_df[col+'_MAX'] - group_df[col+'_MEAN']
        group_df[col+'_mean_min'] = group_df[col+'_MEAN'] - group_df[col+'_MIN']
        df = df.merge(group_df, on=['age','sex','prov_id'], how='left')

#交叉特征的构建
spare_feat=['service_type','product_type','max_rat_flag','is_act_expire','term_type','activity_type','prov_id']
for n1 in range(len(spare_feat)):
        for n2 in range(n1+1,len(spare_feat)):
            f,col=spare_feat[n1],spare_feat[n2]
            tmp = df.groupby([f,col])
            df['{}_{}_count'.format(f, col)]= df.groupby([f,col])['user_id'].transform('count')
            df[f + '_count'] = df.groupby([f])['user_id'].transform('count')
            df[col + '_count'] = df.groupby([col])['user_id'].transform('count')
            df['{}_{}_nunique'.format(f, col)]= df.groupby([f,col])['user_id'].transform('nunique')
            df['{}_{}_count_ratio'.format(col, f)] = df['{}_{}_count'.format(f, col)] / (df[f + '_count']+1)
            df['{}_{}_count_ratio'.format(f, col)] = df['{}_{}_count'.format(f, col)] / (df[col + '_count']+1)
            df['{}_{}_nunique_ratio_{}_count'.format(f, col, f)] = df['{}_{}_nunique'.format(f, col)] / (df[f + '_count']+1)
            del df[f + '_count'],df[col + '_count']

#一、整合每个用户的平均流量信息
def get_flux(data):
    data['flux'] = data['game_app_flux'] + data['live_app_flux'] + data['video_app_flux']
    del data['game_app_flux'],data['live_app_flux'],data['video_app_flux']
    return data
#二、整合每个用户的所有通话次数
def get_numbeus(data):
    data['call_times'] = data['re_call10'] + data['short_call10'] + data['long_call10']
    del data['re_call10'],data['short_call10'],data['long_call10']
    return data
#三、统计每个用户点击的app的数量以及所有app的点击总次数
def get_app(data):
    data['app_nums'] = 0
    data['app_click_nums'] = 0
    for i in ['01','02','03','04','05','06','07','08','09','10','11','12','13','14','15','16','17','18','19','20','21','22','23']:
        data['app_nums'] += data['active_days'+i] != 0
        data['app_click_nums'] += data['active_days'+i]
        del data['active_days'+i]
    return data
#四、将数据按照年龄进行统计特征的构建
df['age_sex'] = df['age'].astype(str) + '-' + df['sex'].astype(str)
#对所有项进行编码
lbl = LabelEncoder()
object_col = ['age_sex']
for i in object_col:
    df[i] = lbl.fit_transform(df[i].astype(str))
def get_digit(data):
    for i in ['age_sex']:
        for j in ['innet_months','total_fee','pay_fee','bank_cnt','flux','call_times','app_click_nums']:
            df['{}_{}_min'.format(i,j)] = df.groupby(i)[j].transform('min')
            df['{}_{}_max'.format(i,j)] = df.groupby(i)[j].transform('max')
            df['{}_{}_median'.format(i,j)] = df.groupby(i)[j].transform('median')
            df['{}_{}_mean'.format(i,j)] = df.groupby(i)[j].transform('mean')
            df['{}_{}_std'.format(i,j)] = df.groupby(i)[j].transform('std')
    return data
#五、每天的平均次数
for i in ['re_call10','short_call10','long_call10','total_times']:
    df['{}_day_mean'.format(i)] = df[i] / (df['call_days']+1)
#尝试构建同年龄段不同用户之间的diff特征
df = df.sort_values('age_sex').reset_index(drop=True)
features = [col for col in df.columns if col not in ['user_id','is_5g','prov_id','area_id','chnl_type','service_type','product_type','manu_name','term_type','max_rat_flag',
'is_5g_base_cover','is_work_5g_cover','is_home_5g_cover','is_work_5g_cover_l01','is_home_5g_cover_l01',
'is_work_5g_cover_l02','is_home_5g_cover_l02','activity_type','is_act_expire','comp_type','city_level',
'city_5g_ratio','age_sex']]
def get_diff(data):
    tmp = data.groupby(['age_sex'])
    for i in features:
        data['{}_diff'.format(i)] = abs(tmp[i].shift(1) - tmp[i].shift(0))
    del tmp
    return data
df = get_diff(df)
#六、count特征的构建
# 10个
for i in ['prov_id','area_id','age_sex']:
    for j in ['comp_type','is_act_expire','product_type','activity_type','city_level','term_type']:
        df = pd.merge(df, df.groupby([i,j])['user_id'].nunique().reset_index().rename(
        columns={'user_id': '{}_{}_nunique'.format(i,j)}), how='left', on=[i,j])

#七、转化率特征构建
def kfold_train_cvr(train_df,f):
    print("K-fold static:",f)
    #K-fold positive and negative num
    index=set(range(train_df.shape[0]))
    K_fold=[]
    for i in range(5):
        if i == 4:
            tmp=index
        else:
            tmp=random.sample(index,int(0.2*train_df.shape[0]))
        index=index-set(tmp)
        print("Number:",len(tmp))
        K_fold.append(tmp)
    positive=[-1 for i in range(train_df.shape[0])]
    negative=[-1 for i in range(train_df.shape[0])]
    for i in range(5):
        print('fold',i)
        pivot_index=K_fold[i]
        sample_idnex=[]
        for j in range(5):
            if j!=i:
                sample_idnex+=K_fold[j]
        dic={}
        #print(dic)
        for item in train_df.iloc[sample_idnex][[f,'is_5g']].values:

            if item[0] not in dic:
                dic[item[0]]=[0,0]

            dic[item[0]][item[1]]+=1

        uid=train_df[f].values
        for k in pivot_index:
            if uid[k] in dic:
                positive[k]=dic[uid[k]][1]
                negative[k]=dic[uid[k]][0]
    train_df[f+'_positive_num']=positive
    train_df[f+'_negative_num']=negative
    train_df[f + '_cvr'] = train[f + '_positive_num'] / (train[f + '_positive_num'] + train[f + '_negative_num'] + 3)

    del train_df[f+'_positive_num']
    del train_df[f+'_negative_num']

    return train_df
'''
做数据类型转化,才能做样本统计
'''
for feat in train.columns:
    train[feat] = train[feat].astype('int64')
# 训练集转化率交叉计算
for feat in ['term_type','max_rat_flag','product_type','prov_id','area_id','comp_type','activity_type','chnl_type',
             'city_level','service_type','age']:
    train = kfold_train_cvr(train,feat)
# 测试集转化率
for feat in ['term_type','max_rat_flag','product_type','prov_id','area_id','comp_type','activity_type','chnl_type',
             'city_level','service_type','age']:
    temp = train[[feat,'is_5g']]
    count_p = temp.groupby(feat)['is_5g'].sum().reset_index(name = feat + '_positive')
    count_n = temp.groupby(feat)['is_5g'].count().reset_index(name = feat + '_negative')
    count_p[feat + '_negative'] = count_n[feat + '_negative']
    count_p[feat +'_cvr'] = round(count_p[feat + '_positive'] / (count_p[feat + '_negative'] + 3) , 5)
    del count_p[feat + '_negative']
    del count_p[feat + '_positive']
    test = test.merge(count_p[[feat,feat + '_cvr']], on=feat,how='left')
附录2: 特征筛选部分代码
# numpy and pandas for data manipulation
import pandas as pd
import numpy as np
# model used for feature importances
import lightgbm as lgb
# utility for early stopping with a validation set
from sklearn.model_selection import train_test_split
# visualizations
import matplotlib.pyplot as plt
import seaborn as sns
# memory management
import gc
# utilities
from itertools import chain
class FeatureSelector():
"""
Class for performing feature selection for machine learning or data preprocessing.
Implements five different methods to identify features for removal
1. Find columns with a missing percentage greater than a specified threshold
2. Find columns with a single unique value
3. Find collinear variables with a correlation greater than a specified correlation coefficient
4. Find features with 0.0 feature importance from a gradient boosting machine (gbm)
5. Find low importance features that do not contribute to a specified cumulative feature importance from the gbm
Parameters
--------
data : dataframe
A dataset with observations in the rows and features in the columns
labels : array or series, default = None
Array of labels for training the machine learning model to find feature importances. These can be either binary labels
(if task is 'classification') or continuous targets (if task is 'regression').
If no labels are provided, then the feature importance based methods are not available.
Attributes
--------
ops : dict
Dictionary of operations run and features identified for removal
missing_stats : dataframe
The fraction of missing values for all features
record_missing : dataframe
The fraction of missing values for features with missing fraction above threshold
unique_stats : dataframe
Number of unique values for all features
record_single_unique : dataframe
Records the features that have a single unique value
corr_matrix : dataframe
All correlations between all features in the data
record_collinear : dataframe
Records the pairs of collinear variables with a correlation coefficient above the threshold
feature_importances : dataframe
All feature importances from the gradient boosting machine
record_zero_importance : dataframe
Records the zero importance features in the data according to the gbm
record_low_importance : dataframe
Records the lowest importance features not needed to reach the threshold of cumulative importance according to the gbm
Notes
--------
- All 5 operations can be run with the `identify_all` method.
- If using feature importances, one-hot encoding is used for categorical variables which creates new columns
"""
def __init__(self, data, labels=None):
# Dataset and optional training labels
self.data = data
self.labels = labels
if labels is None:
print('No labels provided. Feature importance based methods are not available.')
self.base_features = list(data.columns)
self.one_hot_features = None
# Dataframes recording information about features to remove
self.record_missing = None
self.record_single_unique = None
self.record_collinear = None
self.record_zero_importance = None
self.record_low_importance = None
self.missing_stats = None
self.unique_stats = None
self.corr_matrix = None
self.feature_importances = None
# Dictionary to hold removal operations
self.ops = {}
self.one_hot_correlated = False
def identify_missing(self, missing_threshold):
"""Find the features with a fraction of missing values above `missing_threshold`"""
self.missing_threshold = missing_threshold
# Calculate the fraction of missing in each column
missing_series = self.data.isnull().sum() / self.data.shape[0]
self.missing_stats = pd.DataFrame(missing_series).rename(columns={'index': 'feature', 0: 'missing_fraction'})
# Sort with highest number of missing values on top
self.missing_stats = self.missing_stats.sort_values('missing_fraction', ascending=False)
# Find the columns with a missing percentage above the threshold
record_missing = pd.DataFrame(missing_series[missing_series > missing_threshold]).reset_index().rename(columns=
{
'index': 'feature',
0: 'missing_fraction'})
to_drop = list(record_missing['feature'])
self.record_missing = record_missing
self.ops['missing'] = to_drop
print('%d features with greater than %0.2f missing values.\n' % (
len(self.ops['missing']), self.missing_threshold))
def identify_single_unique(self):
"""Finds features with only a single unique value. NaNs do not count as a unique value. """
# Calculate the unique counts in each column
unique_counts = self.data.nunique()
self.unique_stats = pd.DataFrame(unique_counts).rename(columns={'index': 'feature', 0: 'nunique'})
self.unique_stats = self.unique_stats.sort_values('nunique', ascending=True)
# Find the columns with only one unique count
record_single_unique = pd.DataFrame(unique_counts[unique_counts == 1]).reset_index().rename(
columns={'index': 'feature',
0: 'nunique'})
to_drop = list(record_single_unique['feature'])
self.record_single_unique = record_single_unique
self.ops['single_unique'] = to_drop
print('%d features with a single unique value.\n' % len(self.ops['single_unique']))
def identify_collinear(self, correlation_threshold, one_hot=False):
"""
Finds collinear features based on the correlation coefficient between features.
For each pair of features with a correlation coefficient greather than `correlation_threshold`,
only one of the pair is identified for removal.
Using code adapted from: https://chrisalbon.com/machine_learning/feature_selection/drop_highly_correlated_features/
Parameters
--------
correlation_threshold : float between 0 and 1
Value of the Pearson correlation cofficient for identifying correlation features
one_hot : boolean, default = False
Whether to one-hot encode the features before calculating the correlation coefficients
"""
self.correlation_threshold = correlation_threshold
self.one_hot_correlated = one_hot
# Calculate the correlations between every column
if one_hot:
# One hot encoding
features = pd.get_dummies(self.data)
self.one_hot_features = [column for column in features.columns if column not in self.base_features]
# Add one hot encoded data to original data
self.data_all = pd.concat([features[self.one_hot_features], self.data], axis=1)
corr_matrix = pd.get_dummies(features).corr()
else:
corr_matrix = self.data.corr()
self.corr_matrix = corr_matrix
# Extract the upper triangle of the correlation matrix
upper = corr_matrix.where(np.triu(np.ones(corr_matrix.shape), k=1).astype(np.bool))
# Select the features with correlations above the threshold
# Need to use the absolute value
to_drop = [column for column in upper.columns if any(upper[column].abs() > correlation_threshold)]
# Dataframe to hold correlated pairs
record_collinear = pd.DataFrame(columns=['drop_feature', 'corr_feature', 'corr_value'])
# Iterate through the columns to drop to record pairs of correlated features
for column in to_drop:
# Find the correlated features
corr_features = list(upper.index[upper[column].abs() > correlation_threshold])
# Find the correlated values
corr_values = list(upper[column][upper[column].abs() > correlation_threshold])
drop_features = [column for _ in range(len(corr_features))]
# Record the information (need a temp df for now)
temp_df = pd.DataFrame.from_dict({'drop_feature': drop_features,
'corr_feature': corr_features,
'corr_value': corr_values})
# Add to dataframe
record_collinear = record_collinear.append(temp_df, ignore_index=True)
self.record_collinear = record_collinear
self.ops['collinear'] = to_drop
print('%d features with a correlation magnitude greater than %0.2f.\n' % (
len(self.ops['collinear']), self.correlation_threshold))
def identify_zero_importance(self, task, eval_metric=None,
n_iterations=10, early_stopping=True):
"""
Identify the features with zero importance according to a gradient boosting machine.
The gbm can be trained with early stopping using a validation set to prevent overfitting.
The feature importances are averaged over `n_iterations` to reduce variance.
Uses the LightGBM implementation (http://lightgbm.readthedocs.io/en/latest/index.html)
Parameters
--------
eval_metric : string
Evaluation metric to use for the gradient boosting machine for early stopping. Must be
provided if `early_stopping` is True
task : string
The machine learning task, either 'classification' or 'regression'
n_iterations : int, default = 10
Number of iterations to train the gradient boosting machine
early_stopping : boolean, default = True
Whether or not to use early stopping with a validation set when training
Notes
--------
- Features are one-hot encoded to handle the categorical variables before training.
- The gbm is not optimized for any particular task and might need some hyperparameter tuning
- Feature importances, including zero importance features, can change across runs
"""
if early_stopping and eval_metric is None:
raise ValueError("""eval metric must be provided with early stopping. Examples include "auc" for classification or
"l2" for regression.""")
if self.labels is None:
raise ValueError("No training labels provided.")
# One hot encoding
features = pd.get_dummies(self.data)
self.one_hot_features = [column for column in features.columns if column not in self.base_features]
# Add one hot encoded data to original data
self.data_all = pd.concat([features[self.one_hot_features], self.data], axis=1)
# Extract feature names
feature_names = list(features.columns)
# Convert to np array
features = np.array(features)
labels = np.array(self.labels).reshape((-1,))
# Empty array for feature importances
feature_importance_values = np.zeros(len(feature_names))
print('Training Gradient Boosting Model\n')
# Iterate through each fold
for _ in range(n_iterations):
if task == 'classification':
params_initial = {
'objective': 'binary',
'metric': 'auc',
'num_leaves': 32,
'max_bin': 50,
'max_depth': 5,
'min_child_samples': 50,
'min_child_weight': 2,
'n_jobs': -1,
}
model = lgb.LGBMClassifier(n_estimators=1000, **params_initial)
elif task == 'regression':
model = lgb.LGBMRegressor(n_estimators=1000, learning_rate=0.05, verbose=0)
else:
raise ValueError('Task must be either "classification" or "regression"')
# If training using early stopping need a validation set
if early_stopping:
train_features, valid_features, train_labels, valid_labels = train_test_split(features, labels,
test_size=0.4,
stratify=labels)
# Train the model with early stopping
model.fit(train_features, train_labels, eval_set=[(valid_features, valid_labels)], verbose=0, early_stopping_rounds=50)
# Clean up memory
gc.enable()
del train_features, train_labels, valid_features, valid_labels
gc.collect()
else:
model.fit(features, labels)
# Record the feature importances
feature_importance_values += model.feature_importances_ / n_iterations
feature_importances = pd.DataFrame({'feature': feature_names, 'importance': feature_importance_values})
# Sort features according to importance
feature_importances = feature_importances.sort_values('importance', ascending=False).reset_index(drop=True)
# Normalize the feature importances to add up to one
feature_importances['normalized_importance'] = feature_importances['importance'] / feature_importances[
'importance'].sum()
feature_importances['cumulative_importance'] = np.cumsum(feature_importances['normalized_importance'])
# Extract the features with zero importance
record_zero_importance = feature_importances[feature_importances['importance'] == 0.0]
to_drop = list(record_zero_importance['feature'])
self.feature_importances = feature_importances
self.record_zero_importance = record_zero_importance
self.ops['zero_importance'] = to_drop
print('\n%d features with zero importance after one-hot encoding.\n' % len(self.ops['zero_importance']))
def identify_low_importance(self, cumulative_importance):
"""
Finds the lowest importance features not needed to account for `cumulative_importance` fraction
of the total feature importance from the gradient boosting machine. As an example, if cumulative
importance is set to 0.95, this will retain only the most important features needed to
reach 95% of the total feature importance. The identified features are those not needed.
Parameters
--------
cumulative_importance : float between 0 and 1
The fraction of cumulative importance to account for
"""
self.cumulative_importance = cumulative_importance
# The feature importances need to be calculated before running
if self.feature_importances is None:
raise NotImplementedError("""Feature importances have not yet been determined.
Call the `identify_zero_importance` method first.""")
# Make sure most important features are on top
self.feature_importances = self.feature_importances.sort_values('cumulative_importance')
# Identify the features not needed to reach the cumulative_importance
record_low_importance = self.feature_importances[
self.feature_importances['cumulative_importance'] > cumulative_importance]
to_drop = list(record_low_importance['feature'])
self.record_low_importance = record_low_importance
self.ops['low_importance'] = to_drop
print('%d features required for cumulative importance of %0.2f after one hot encoding.' % (
len(self.feature_importances) -
len(self.record_low_importance), self.cumulative_importance))
print('%d features do not contribute to cumulative importance of %0.2f.\n' % (len(self.ops['low_importance']),
self.cumulative_importance))
def identify_all(self, selection_params):
"""
Use all five of the methods to identify features to remove.
Parameters
--------
selection_params : dict
Parameters to use in the five feature selection methhods.
Params must contain the keys ['missing_threshold', 'correlation_threshold', 'eval_metric', 'task', 'cumulative_importance']
"""
# Check for all required parameters
for param in ['missing_threshold', 'correlation_threshold', 'eval_metric', 'task', 'cumulative_importance']:
if param not in selection_params.keys():
raise ValueError('%s is a required parameter for this method.' % param)
# Implement each of the five methods
self.identify_missing(selection_params['missing_threshold'])
self.identify_single_unique()
self.identify_collinear(selection_params['correlation_threshold'])
self.identify_zero_importance(task=selection_params['task'], eval_metric=selection_params['eval_metric'])
self.identify_low_importance(selection_params['cumulative_importance'])
# Find the number of features identified to drop
self.all_identified = set(list(chain(*list(self.ops.values()))))
self.n_identified = len(self.all_identified)
print('%d total features out of %d identified for removal after one-hot encoding.\n' % (self.n_identified,
self.data_all.shape[1]))
def check_removal(self, keep_one_hot=True):
"""Check the identified features before removal. Returns a list of the unique features identified."""
self.all_identified = set(list(chain(*list(self.ops.values()))))
print('Total of %d features identified for removal' % len(self.all_identified))
if not keep_one_hot:
if self.one_hot_features is None:
print('Data has not been one-hot encoded')
else:
one_hot_to_remove = [x for x in self.one_hot_features if x not in self.all_identified]
print('%d additional one-hot features can be removed' % len(one_hot_to_remove))
return list(self.all_identified)
def remove(self, methods, keep_one_hot=True):
"""
Remove the features from the data according to the specified methods.
Parameters
--------
methods : 'all' or list of methods
If methods == 'all', any methods that have identified features will be used
Otherwise, only the specified methods will be used.
Can be one of ['missing', 'single_unique', 'collinear', 'zero_importance', 'low_importance']
keep_one_hot : boolean, default = True
Whether or not to keep one-hot encoded features
Return
--------
data : dataframe
Dataframe with identified features removed
Notes
--------
- If feature importances are used, the one-hot encoded columns will be added to the data (and then may be removed)
- Check the features that will be removed before transforming data!
"""
features_to_drop = []
if methods == 'all':
# Need to use one-hot encoded data as well
data = self.data_all
print('{} methods have been run\n'.format(list(self.ops.keys())))
# Find the unique features to drop
features_to_drop = set(list(chain(*list(self.ops.values()))))
else:
# Need to use one-hot encoded data as well
if 'zero_importance' in methods or 'low_importance' in methods or self.one_hot_correlated:
data = self.data_all
else:
data = self.data
# Iterate through the specified methods
for method in methods:
# Check to make sure the method has been run
if method not in self.ops.keys():
raise NotImplementedError('%s method has not been run' % method)
# Append the features identified for removal
else:
features_to_drop.append(self.ops[method])
# Find the unique features to drop
features_to_drop = set(list(chain(*features_to_drop)))
features_to_drop = list(features_to_drop)
if not keep_one_hot:
if self.one_hot_features is None:
print('Data has not been one-hot encoded')
else:
features_to_drop = list(set(features_to_drop) | set(self.one_hot_features))
# Remove the features and return the data
data = data.drop(columns=features_to_drop)
self.removed_features = features_to_drop
if not keep_one_hot:
print('Removed %d features including one-hot features.' % len(features_to_drop))
else:
print('Removed %d features.' % len(features_to_drop))
return data
def plot_missing(self):
"""Histogram of missing fraction in each feature"""
if self.record_missing is None:
raise NotImplementedError("Missing values have not been calculated. Run `identify_missing`")
self.reset_plot()
# Histogram of missing values
plt.style.use('seaborn-white')
plt.figure(figsize=(7, 5))
plt.hist(self.missing_stats['missing_fraction'], bins=np.linspace(0, 1, 11), edgecolor='k', color='red',
linewidth=1.5)
plt.xticks(np.linspace(0, 1, 11));
plt.xlabel('Missing Fraction', size=14);
plt.ylabel('Count of Features', size=14);
plt.title("Fraction of Missing Values Histogram", size=16);
def plot_unique(self):
"""Histogram of number of unique values in each feature"""
if self.record_single_unique is None:
raise NotImplementedError('Unique values have not been calculated. Run `identify_single_unique`')
self.reset_plot()
# Histogram of number of unique values
self.unique_stats.plot.hist(edgecolor='k', figsize=(7, 5))
plt.ylabel('Frequency', size=14);
plt.xlabel('Unique Values', size=14);
plt.title('Number of Unique Values Histogram', size=16);
def plot_collinear(self, plot_all=False):
"""
Heatmap of the correlation values. If plot_all = True plots all the correlations otherwise
plots only those features that have a correlation above the threshold
Notes
--------
- Not all of the plotted correlations are above the threshold because this plots
all the variables that have been idenfitied as having even one correlation above the threshold
- The features on the x-axis are those that will be removed. The features on the y-axis
are the correlated features with those on the x-axis
Code adapted from https://seaborn.pydata.org/examples/many_pairwise_correlations.html
"""
if self.record_collinear is None:
raise NotImplementedError('Collinear features have not been idenfitied. Run `identify_collinear`.')
if plot_all:
corr_matrix_plot = self.corr_matrix
title = 'All Correlations'
else:
# Identify the correlations that were above the threshold
# columns (x-axis) are features to drop and rows (y_axis) are correlated pairs
corr_matrix_plot = self.corr_matrix.loc[list(set(self.record_collinear['corr_feature'])),
list(set(self.record_collinear['drop_feature']))]
title = "Correlations Above Threshold"
f, ax = plt.subplots(figsize=(10, 8))
# Diverging colormap
cmap = sns.diverging_palette(220, 10, as_cmap=True)
# Draw the heatmap with a color bar
sns.heatmap(corr_matrix_plot, cmap=cmap, center=0,
linewidths=.25, cbar_kws={"shrink": 0.6})
# Set the ylabels
ax.set_yticks([x + 0.5 for x in list(range(corr_matrix_plot.shape[0]))])
ax.set_yticklabels(list(corr_matrix_plot.index), size=int(160 / corr_matrix_plot.shape[0]));
# Set the xlabels
ax.set_xticks([x + 0.5 for x in list(range(corr_matrix_plot.shape[1]))])
ax.set_xticklabels(list(corr_matrix_plot.columns), size=int(160 / corr_matrix_plot.shape[1]));
plt.title(title, size=14)
def plot_feature_importances(self, plot_n=15, threshold=None):
"""
Plots `plot_n` most important features and the cumulative importance of features.
If `threshold` is provided, prints the number of features needed to reach `threshold` cumulative importance.
Parameters
--------
plot_n : int, default = 15
Number of most important features to plot. Defaults to 15 or the maximum number of features whichever is smaller
threshold : float, between 0 and 1 default = None
Threshold for printing information about cumulative importances
"""
if self.record_zero_importance is None:
raise NotImplementedError('Feature importances have not been determined. Run `idenfity_zero_importance`')
# Need to adjust number of features if greater than the features in the data
if plot_n > self.feature_importances.shape[0]:
plot_n = self.feature_importances.shape[0] - 1
self.reset_plot()
# Make a horizontal bar chart of feature importances
plt.figure(figsize=(10, 6))
ax = plt.subplot()
# Need to reverse the index to plot most important on top
# There might be a more efficient method to accomplish this
ax.barh(list(reversed(list(self.feature_importances.index[:plot_n]))),
self.feature_importances['normalized_importance'][:plot_n],
align='center', edgecolor='k')
# Set the yticks and labels
ax.set_yticks(list(reversed(list(self.feature_importances.index[:plot_n]))))
ax.set_yticklabels(self.feature_importances['feature'][:plot_n], size=12)
# Plot labeling
plt.xlabel('Normalized Importance', size=16);
plt.title('Feature Importances', size=18)
plt.show()
# Cumulative importance plot
plt.figure(figsize=(6, 4))
plt.plot(list(range(1, len(self.feature_importances) + 1)), self.feature_importances['cumulative_importance'],
'r-')
plt.xlabel('Number of Features', size=14);
plt.ylabel('Cumulative Importance', size=14);
plt.title('Cumulative Feature Importance', size=16);
if threshold:
# Index of minimum number of features needed for cumulative importance threshold
# np.where returns the index so need to add 1 to have correct number
importance_index = np.min(np.where(self.feature_importances['cumulative_importance'] > threshold))
plt.vlines(x=importance_index + 1, ymin=0, ymax=1, linestyles='--', colors='blue')
plt.show();
print('%d features required for %0.2f of cumulative importance' % (importance_index + 1, threshold))
def reset_plot(self):
plt.rcParams = plt.rcParamsDefault


 被折叠的 条评论
为什么被折叠?
被折叠的 条评论
为什么被折叠?
 到【灌水乐园】发言


