


一、ELK 日志采集概述
- ELK 即 Elasticsearch、Logstash、Kibana,组合起来可以搭建线上日志系统,在目前这种分布式微服务系统中,通过 ELK 会非常方便的查询和统计日志情况.
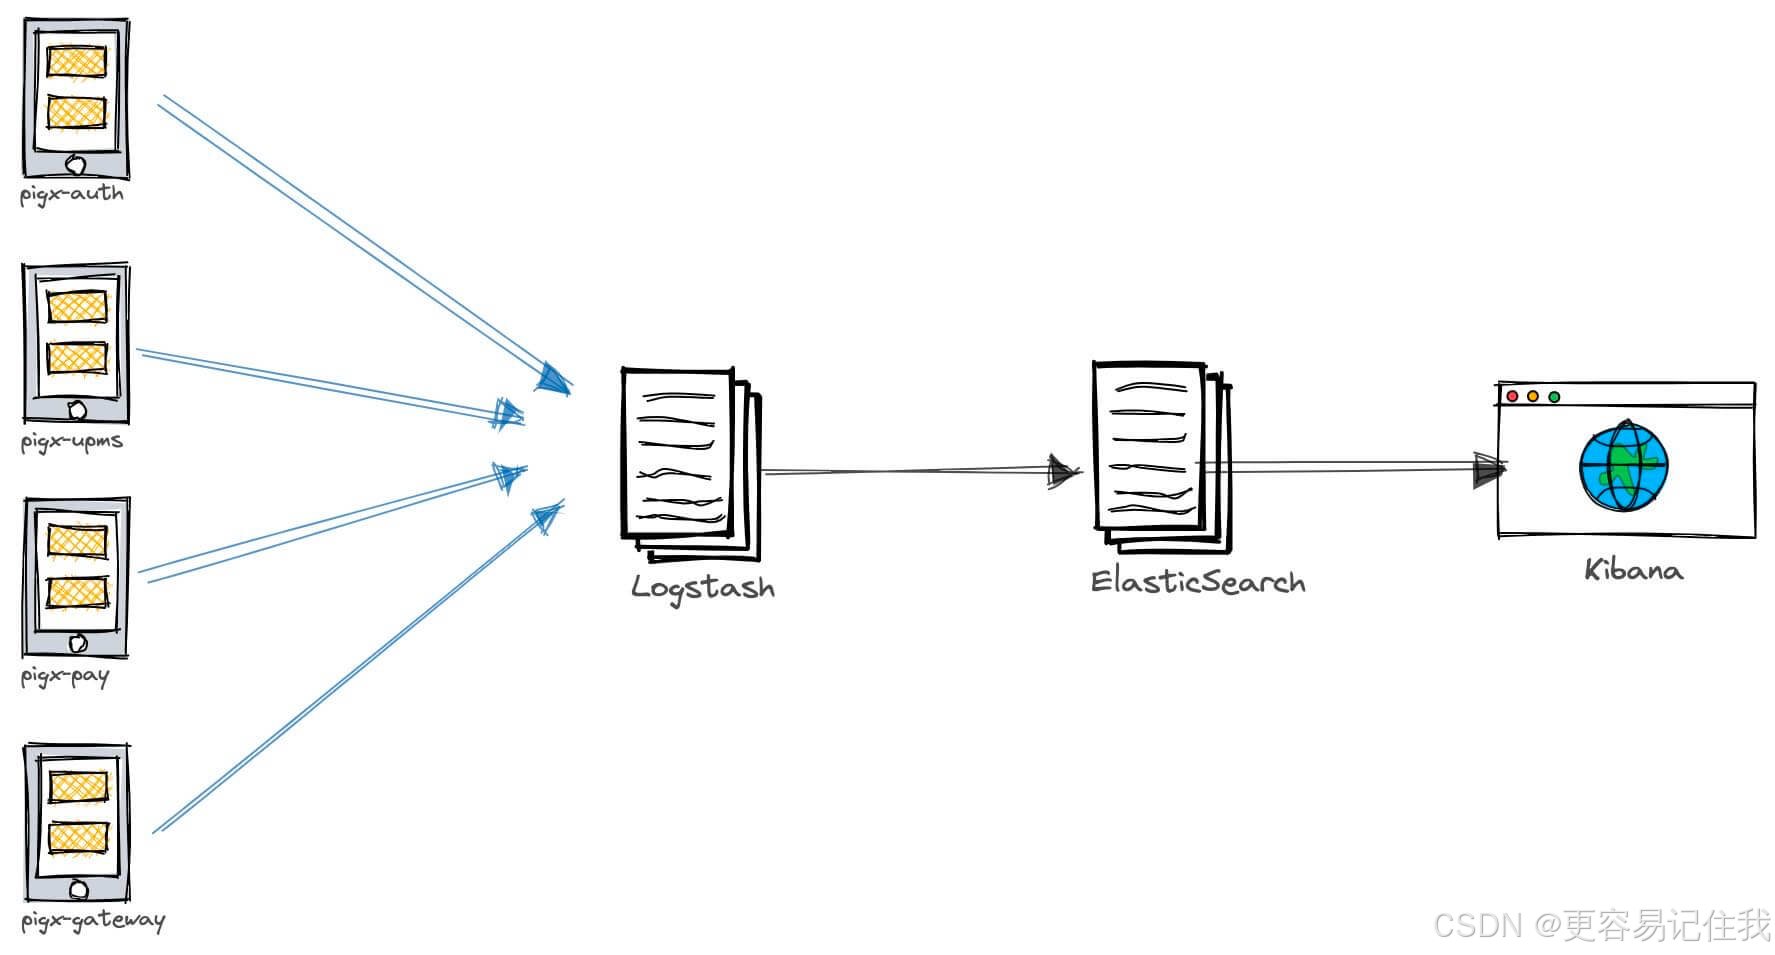
二、ELK 中各个服务的作用
- Elasticsearch:用于存储收集到的日志信息;
- Logstash:用于收集日志,应用整合了 Logstash 以后会把日志发送给 Logstash,Logstash 再把日志转发给 Elasticsearch;
- Kibana:通过 Web 端的可视化界面来查看日志。
三、搭建 ELK 环境
3.1、安装es(安装版本7.17.16)
- https://www.elastic.co/cn/downloads/past-releases#elasticsearch
- 解压安装后修改配置文件 elasticsearch.yml
- es需要配置系统参数
- vim /etc/sysctl.conf
- vm.max_map_count=262144
- sysctl -p #刷新配置
- vim /etc/security/limits.conf
- es hard nofile 65536
- es soft nofile 65536
# ======================== Elasticsearch Configuration =========================
#
# NOTE: Elasticsearch comes with reasonable defaults for most settings.
#       Before you set out to tweak and tune the configuration, make sure you
#       understand what are you trying to accomplish and the consequences.
#
# The primary way of configuring a node is via this file. This template lists
# the most important settings you may want to configure for a production cluster.
#
# Please consult the documentation for further information on configuration options:
# https://www.elastic.co/guide/en/elasticsearch/reference/index.html
#
# ---------------------------------- Cluster -----------------------------------
#
# Use a descriptive name for your cluster:
#
#cluster.name: my-application
#
# ------------------------------------ Node ------------------------------------
#
# Use a descriptive name for the node:
#
#node.name: node-1
#
# Add custom attributes to the node:
#
#node.attr.rack: r1
#
# ----------------------------------- Paths ------------------------------------
#
# Path to directory where to store the data (separate multiple locations by comma):
#
#path.data: /path/to/data
#
# Path to log files:
#
#path.logs: /path/to/logs
#
# ----------------------------------- Memory -----------------------------------
#
# Lock the memory on startup:
#
#bootstrap.memory_lock: true
#
# Make sure that the heap size is set to about half the memory available
# on the system and that the owner of the process is allowed to use this
# limit.
#
# Elasticsearch performs poorly when the system is swapping the memory.
#
# ---------------------------------- Network -----------------------------------
#
# By default Elasticsearch is only accessible on localhost. Set a different
# address here to expose this node on the network:
#
network.host: 0.0.0.0
#
# By default Elasticsearch listens for HTTP traffic on the first free port it
# finds starting at 9200. Set a specific HTTP port here:
#
http.port: 9200
#
# For more information, consult the network module documentation.
#
# --------------------------------- Discovery ----------------------------------
#
# Pass an initial list of hosts to perform discovery when this node is started:
# The default list of hosts is ["127.0.0.1", "[::1]"]
#
#discovery.seed_hosts: ["host1", "host2"]
#
# Bootstrap the cluster using an initial set of master-eligible nodes:
#
#cluster.initial_master_nodes: ["node-1", "node-2"]
#
# For more information, consult the discovery and cluster formation module documentation.
#
# ---------------------------------- Various -----------------------------------
#
# Require explicit names when deleting indices:
#
#action.destructive_requires_name: true
#
# ---------------------------------- Security ----------------------------------
#
#                                 *** WARNING ***
#
# Elasticsearch security features are not enabled by default.
# These features are free, but require configuration changes to enable them.
# This means that users don’t have to provide credentials and can get full access
# to the cluster. Network connections are also not encrypted.
#
# To protect your data, we strongly encourage you to enable the Elasticsearch security features.
# Refer to the following documentation for instructions.
#
# https://www.elastic.co/guide/en/elasticsearch/reference/7.16/configuring-stack-security.html

discovery.seed_hosts: ["127.0.0.1"]
3.2、安装kibana (安装7.17.16)
- https://www.elastic.co/cn/downloads/past-releases#kibana
- 解压后配置kibana.yml
# Kibana is served by a back end server. This setting specifies the port to use.
#server.port: 5601

# Specifies the address to which the Kibana server will bind. IP addresses and host names are both valid values.
# The default is 'localhost', which usually means remote machines will not be able to connect.
# To allow connections from remote users, set this parameter to a non-loopback address.
#server.host: "localhost"

# Enables you to specify a path to mount Kibana at if you are running behind a proxy.
# Use the `server.rewriteBasePath` setting to tell Kibana if it should remove the basePath
# from requests it receives, and to prevent a deprecation warning at startup.
# This setting cannot end in a slash.
#server.basePath: ""

# Specifies whether Kibana should rewrite requests that are prefixed with
# `server.basePath` or require that they are rewritten by your reverse proxy.
# This setting was effectively always `false` before Kibana 6.3 and will
# default to `true` starting in Kibana 7.0.
#server.rewriteBasePath: false

# Specifies the public URL at which Kibana is available for end users. If
# `server.basePath` is configured this URL should end with the same basePath.
#server.publicBaseUrl: ""

# The maximum payload size in bytes for incoming server requests.
#server.maxPayload: 1048576

# The Kibana server's name.  This is used for display purposes.
#server.name: "your-hostname"

# The URLs of the Elasticsearch instances to use for all your queries.
#elasticsearch.hosts: ["http://localhost:9200"]

# Kibana uses an index in Elasticsearch to store saved searches, visualizations and
# dashboards. Kibana creates a new index if the index doesn't already exist.
#kibana.index: ".kibana"

# The default application to load.
#kibana.defaultAppId: "home"

# If your Elasticsearch is protected with basic authentication, these settings provide
# the username and password that the Kibana server uses to perform maintenance on the Kibana
# index at startup. Your Kibana users still need to authenticate with Elasticsearch, which
# is proxied through the Kibana server.
#elasticsearch.username: "kibana_system"
#elasticsearch.password: "pass"

# Kibana can also authenticate to Elasticsearch via "service account tokens".
# If may use this token instead of a username/password.
# elasticsearch.serviceAccountToken: "my_token"

# Enables SSL and paths to the PEM-format SSL certificate and SSL key files, respectively.
# These settings enable SSL for outgoing requests from the Kibana server to the browser.
#server.ssl.enabled: false
#server.ssl.certificate: /path/to/your/server.crt
#server.ssl.key: /path/to/your/server.key

# Optional settings that provide the paths to the PEM-format SSL certificate and key files.
# These files are used to verify the identity of Kibana to Elasticsearch and are required when
# xpack.security.http.ssl.client_authentication in Elasticsearch is set to required.
#elasticsearch.ssl.certificate: /path/to/your/client.crt
#elasticsearch.ssl.key: /path/to/your/client.key

# Optional setting that enables you to specify a path to the PEM file for the certificate
# authority for your Elasticsearch instance.
#elasticsearch.ssl.certificateAuthorities: [ "/path/to/your/CA.pem" ]

# To disregard the validity of SSL certificates, change this setting's value to 'none'.
#elasticsearch.ssl.verificationMode: full

# Time in milliseconds to wait for Elasticsearch to respond to pings. Defaults to the value of
# the elasticsearch.requestTimeout setting.
#elasticsearch.pingTimeout: 1500

# Time in milliseconds to wait for responses from the back end or Elasticsearch. This value
# must be a positive integer.
#elasticsearch.requestTimeout: 30000

# List of Kibana client-side headers to send to Elasticsearch. To send *no* client-side
# headers, set this value to [] (an empty list).
#elasticsearch.requestHeadersWhitelist: [ authorization ]

# Header names and values that are sent to Elasticsearch. Any custom headers cannot be overwritten
# by client-side headers, regardless of the elasticsearch.requestHeadersWhitelist configuration.
#elasticsearch.customHeaders: {}

# Time in milliseconds for Elasticsearch to wait for responses from shards. Set to 0 to disable.
#elasticsearch.shardTimeout: 30000

# Logs queries sent to Elasticsearch. Requires logging.verbose set to true.
#elasticsearch.logQueries: false

# Specifies the path where Kibana creates the process ID file.
#pid.file: /run/kibana/kibana.pid

# Enables you to specify a file where Kibana stores log output.
#logging.dest: stdout

# Set the value of this setting to true to suppress all logging output.
#logging.silent: false

# Set the value of this setting to true to suppress all logging output other than error messages.
#logging.quiet: false

# Set the value of this setting to true to log all events, including system usage information
# and all requests.
#logging.verbose: false

# Set the interval in milliseconds to sample system and process performance
# metrics. Minimum is 100ms. Defaults to 5000.
#ops.interval: 5000

# Specifies locale to be used for all localizable strings, dates and number formats.
# Supported languages are the following: English - en , by default , Chinese - zh-CN .
#i18n.locale: "en"


i18n.locale: "zh-CN"
server.host: "0.0.0.0"
elasticsearch.hosts: ["http://localhost:9200"]
3.3、安装logstash(安装7.17.16)
- https://www.elastic.co/cn/downloads/past-releases#logstash
- 增加配置文件yasee-logstash.conf
- 安装json插件
- ./logstash-plugin install logstash-codec-json_lines
input {

  tcp {

   add_field => {"service" => "upms"}

    mode => "server"

    host => "0.0.0.0"

    port => 40001

    codec => json_lines

  }

}

output {

   if [service] == "upms"{

    elasticsearch {

      hosts => "127.0.0.1:9200"

      index => "upms-lgstash-%{+YYYY.MM.dd}"

    }

   }

}
四、启动 ELK 服务
- 启动ES 端口:9200 9300
- su es
- 进入es的bin目录
- ./elasticsearch -d
- 启动kibana 端口:5601
- su es
- 进入 kibana的安装目录
- nohup ./bin/kibana &
- 启动 logstash 端口:9600
- su root
- 进入 logstash目录
- nohup ./bin/logstash -f ./config/yasee-logstash.conf &
五、访问宿主机 5601 kibana
- http://xxxxx:5601
六、服务整合 Logstash
- 添加 pom 依赖
<!--集成logstash-->
<dependency>
    <groupId>net.logstash.logback</groupId>
    <artifactId>logstash-logback-encoder</artifactId>
    <version>5.3</version>
</dependency>
<!--集成链路追踪-->
<dependency>
    <groupId>com.pig4cloud.plugin</groupId>
    <artifactId>log-trace-spring-boot-starter</artifactId>
    <version>1.1.0</version>
</dependency>
- logback-spring.xml 新增 appender
 <!--输出到logstash的appender-->
<appender name="LOGSTASH" class="net.logstash.logback.appender.LogstashTcpSocketAppender">
   <!--可以访问的logstash日志收集端口 与对应logstash配置对应-->
   <!-- <destination>logstash安装的服务ip:logstash配置文件中配置的的服务对应的ip</destination>-->
    <destination>yasee-logstash:40001</destination>
    <encoder charset="UTF-8" class="net.logstash.logback.encoder.LogstashEncoder"/>
</appender>
<root level="INFO">
    <appender-ref ref="LOGSTASH"/>
</root>
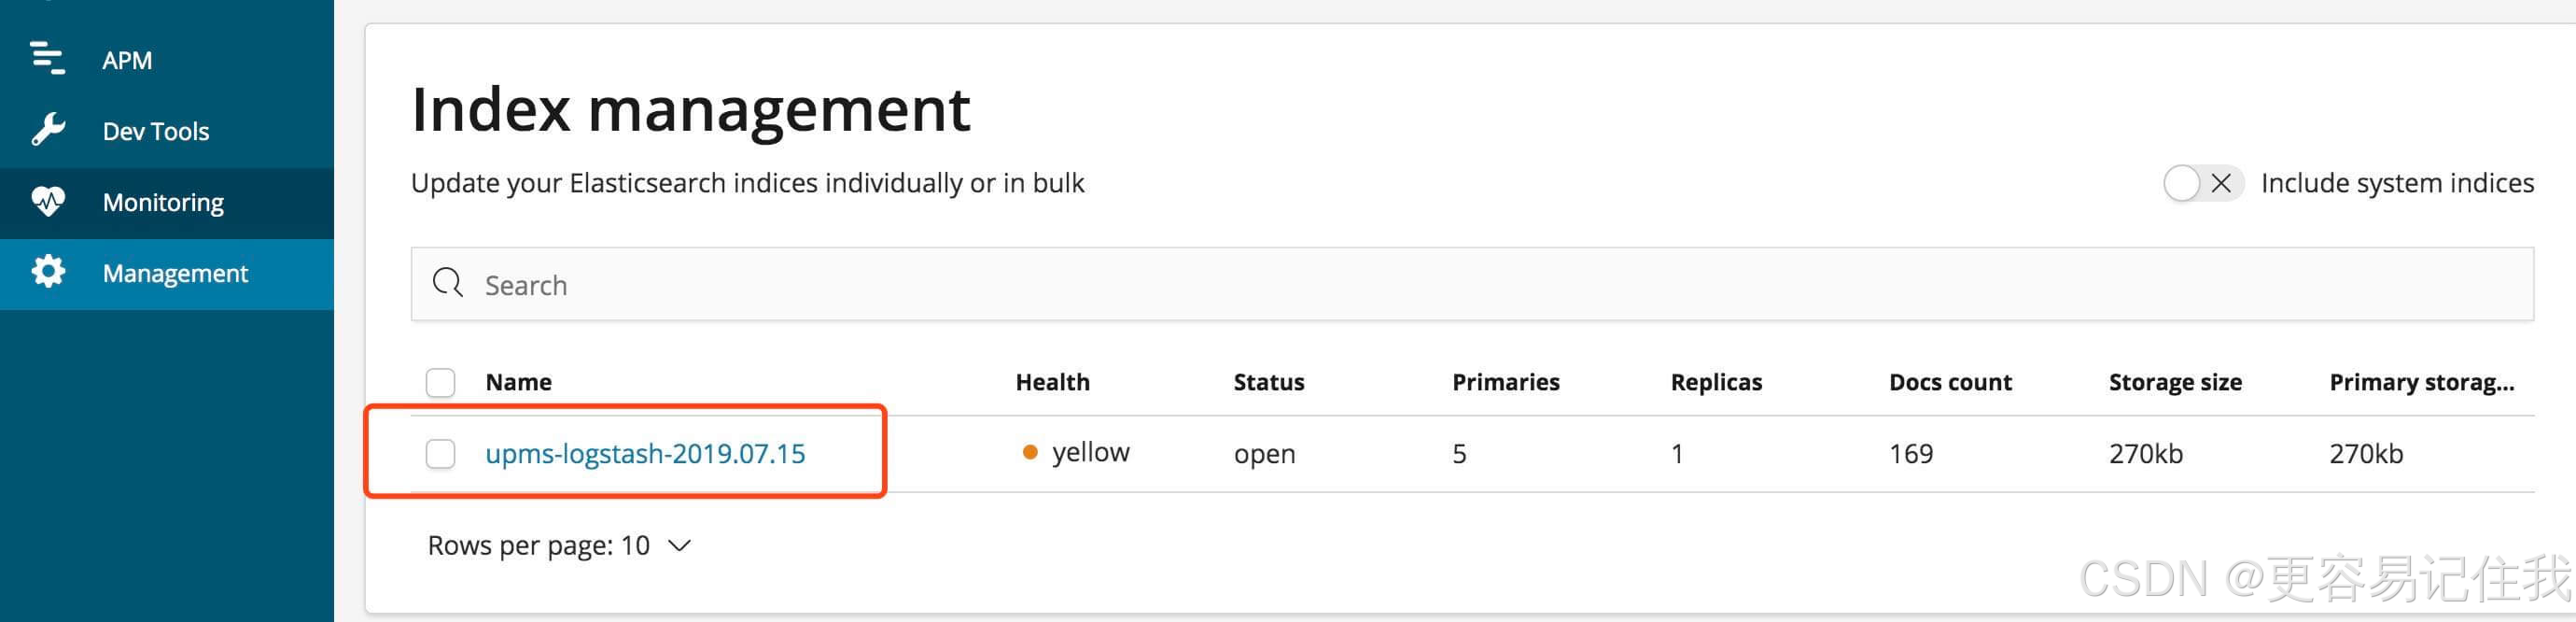
七、在 kibana 中查询日志

八、同时采集多个模块日志
input {
  tcp {
   add_field => {"service" => "upms"}
    mode => "server"
    host => "0.0.0.0"
    port => 40001
    codec => json_lines
  }
  tcp {
   add_field => {"service" => "auth"}
    mode => "server"
    host => "0.0.0.0"
    port => 30001
    codec => json_lines
  }
    file {

    path => "/yasee/log/cdms-socket-dev-7110-7110.info.log"

    start_position => "beginning"  # 日志从头开始记录

    stat_interval => "3"  # 3秒一次检查有没有更新文件

    type => "socket"

  }
}
output {
   if [service] == "upms"{
    elasticsearch {
      hosts => "yasee-es:9200"
      index => "upms-logstash-%{+YYYY.MM.dd}"
    }
   }
  if [service] == "auth"{
    elasticsearch {
      hosts => "yasee-es:9200"
      index => "auth-logstash-%{+YYYY.MM.dd}"
    }
   }

   if [type] == "socket"{

    elasticsearch {

      hosts => "192.168.110.222:9200"  #  es的地址

      index => "socket-lgstash-%{+YYYY.MM.dd}"

      document_type => "log"

    }

   }
}


 703
703

 被折叠的 条评论
为什么被折叠?
被折叠的 条评论
为什么被折叠?
 到【灌水乐园】发言


