


 这篇博客介绍了如何使用Python中的groupby和unstack方法对数据进行处理,通过示例展示了如何对数据进行聚合和转置操作。接着,利用处理后的数据进行柱状图的绘制,强调了在图表中设置字体和调整图例位置的方法,提供了完整的代码示例。
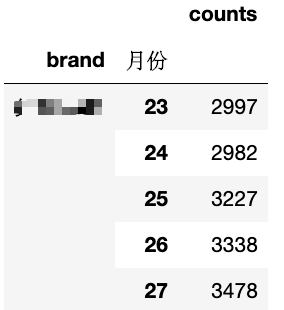
x = data.groupby([‘brand’,‘月份’]).sum()[‘counts’].to_frame()
x = x[x[‘counts’]>=1000]
x.head()
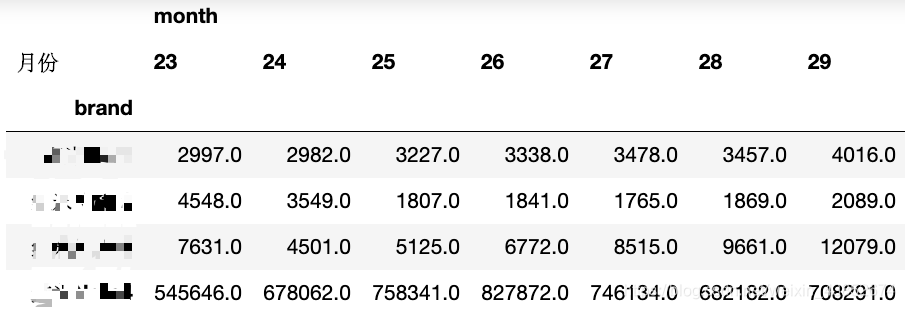
x = x.rename(columns={‘counts’:‘month’})
tmp = x.unstack()
tmp
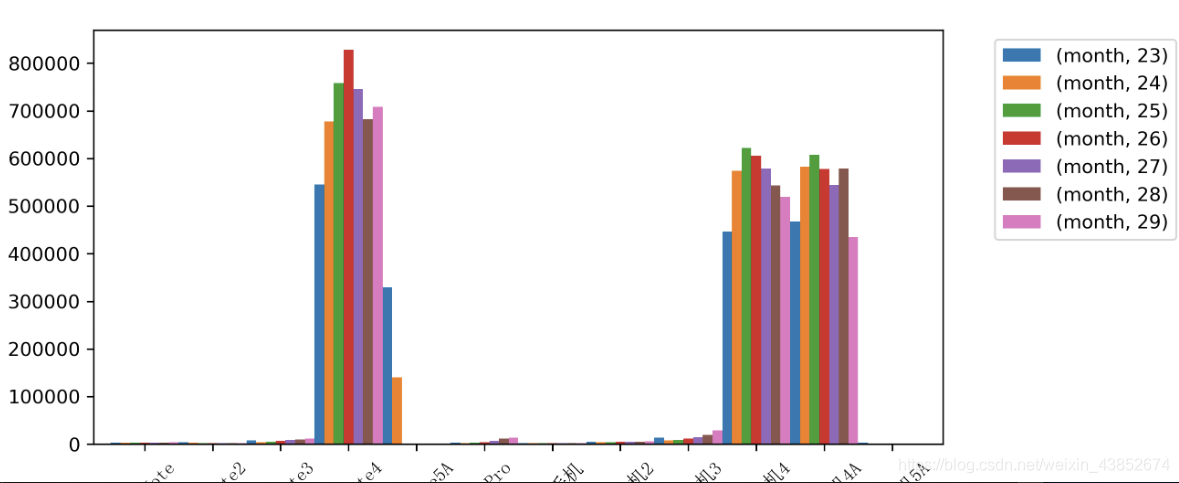
fonts = fm.FontProperties(fname=‘simsun.ttc’) # 设置字体
plt.figure(figsize=(100,5))
tmp.plot(kind=‘bar’,width= 1)
plt.xticks(fontproperties=fonts,rotation=45)
plt.legend(loc=2, bbox_to_anchor=(1.05,1.0)) ##设置ax4中legend的位置,将其放在图外
plt.show()
fonts = fm.FontProperties(fname=‘simsun.ttc’) # 设置字体
转置之后再绘制
(tmp.T).plot(kind=‘bar’,width= 1)
plt.xticks(fontproperties=fonts,rotation=45)
plt.xlabel(xlabel=’’,fontproperties=fonts)
plt.legend(loc=2, bbox_to_anchor=(1.05,1.0),prop=fonts)
plt.show()
 最低0.47元/天 解锁文章


 5581
5581

 被折叠的 条评论
为什么被折叠?
被折叠的 条评论
为什么被折叠?
 到【灌水乐园】发言


