


 本文是基于微软的AirSim仿真环境的自动驾驶教程,讲解如何使用AirSim收集数据训练和测试端到端深度学习模型。内容包括数据探索、模型训练和测试,以及Ubuntu18.04环境下AirSim的配置解决方案。教程中提到,通过数据增强和模型训练,使模型能根据摄像头输入预测转向角度。
这是微软自动驾驶食谱的第一个教程(目前共两个)。之前看到过,这里记录一下。
https://github.com/microsoft/AutonomousDrivingCookbook
前言
在本教程中,将学习如何使用AirSim仿真环境收集的数据来训练和测试自动驾驶的端到端深度学习模型。将训练一个模型,学习如何通过山脉/景观地图的一部分,在AirSim使用一个单一的正面面对网络摄像头(webcam)采集到的画面作为输入去操纵汽车。这样的任务通常被认为是自动驾驶的“hello world”,
教程结构
用Keras框架。
步骤0 -数据探索和准备
概述
训练一个深度学习模型,
输入:摄像头的画面和车辆最后已知状态
输出:转向角度预测。
端到端自动驾驶
不用解释了吧。不像需要特征工程等传统机器学习方法,数据输入神经网络,直接得到输出。唯一的缺点就是需要大量数据,但模拟器可以用来采集数据,之后用少量的真实数据进行微调(Behavioral Cloning),便可实现端到端自动驾驶。
下载数据集:
https://aka.ms/AirSimTutorialDataset
数据集的百度网盘链接:
链接:https://pan.baidu.com/s/1l_YJ6c9VAJS_pkIJeSWSFw
提取码:fwr3
复制这段内容后打开百度网盘手机App,操作更方便哦
代码解读如下:
注:<< ...... >>符号代表你需要对代码根据自己的实际路径进行修改。
%matplotlib inline
import numpy as np
import pandas as pd
import h5py
import matplotlib.pyplot as plt
from PIL import Image, ImageDraw
import os
import Cooking
import random

# << Point this to the directory containing the raw data >>
RAW_DATA_DIR = 'data_raw/'

# << Point this to the desired output directory for the cooked (.h5) data >>
COOKED_DATA_DIR = 'data_cooked/'

# The folders to search for data under RAW_DATA_DIR
# For example, the first folder searched will be RAW_DATA_DIR/normal_1
DATA_FOLDERS = ['normal_1', 'normal_2', 'normal_3', 'normal_4', 'normal_5', 'normal_6', 'swerve_1', 'swerve_2', 'swerve_3']

# The size of the figures in this notebook
FIGURE_SIZE = (10,10)
数据集由两部分组成:图像和.tsv 文件。先看一下.tsv 文件格式。
sample_tsv_path = os.path.join(RAW_DATA_DIR, 'normal_1/airsim_rec.txt')
sample_tsv = pd.read_csv(sample_tsv_path, sep='\t') # https://blog.youkuaiyun.com/b876144622/article/details/80781917
sample_tsv.head()
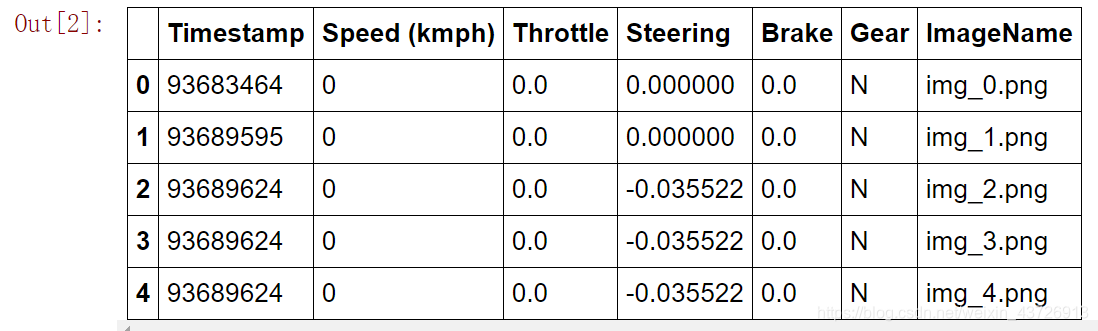
数据集包含标签:转向角度;图像名称等。
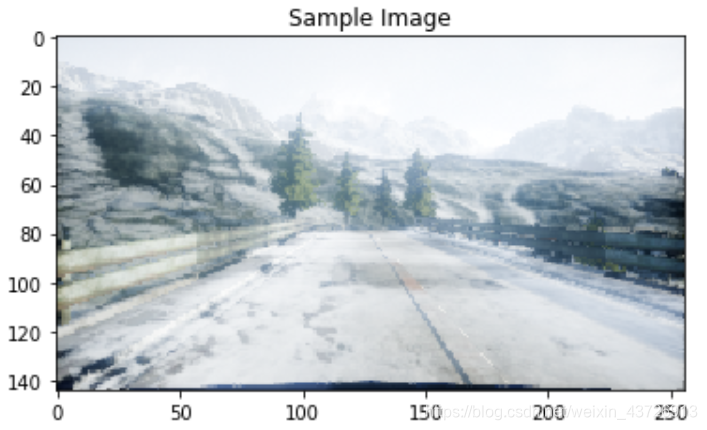
看一个图片:normal_1文件夹下的img_0。
sample_image_path = os.path.join(RAW_DATA_DIR, 'normal_1/images/img_0.png')
sample_image = Image.open(sample_image_path)
plt.title('Sample Image')
plt.imshow(sample_image)
plt.show()
我们只对图像中的一小部分感兴趣,ROI区域如下图中红框区域:
sample_image_roi = sample_image.copy()

fillcolor=(255,0,0)
draw = ImageDraw.Draw(sample_image_roi)
points = [(1,76), (1,135), (255,135), (255,76)]
for i in range(0, len(points), 1): # 1是步长,默认为1,不写也行。https://www.runoob.com/python/python-func-range.html
    draw.line([points[i], points[(i+1)%len(points)]], fill=fillcolor, width=3) # 这里的写法,可以学习
del draw

plt.title('Image with sample ROI')
plt.imshow(sample_image_roi)
plt.show()
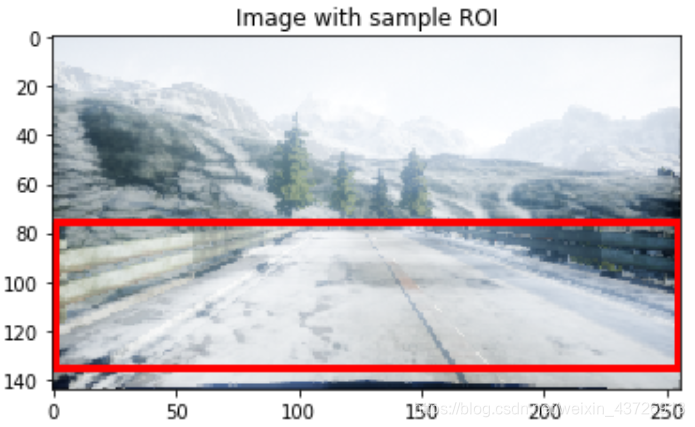
提取ROI既可以减少训练时间,也可以减少训练模型所需的数据量。它还可以防止模型因关注于环境中的不相关特征(例如山、树等)而混淆。
数据增强:
- 沿竖直方向镜像图像,同时将转角取负号。
- 更改全局光照
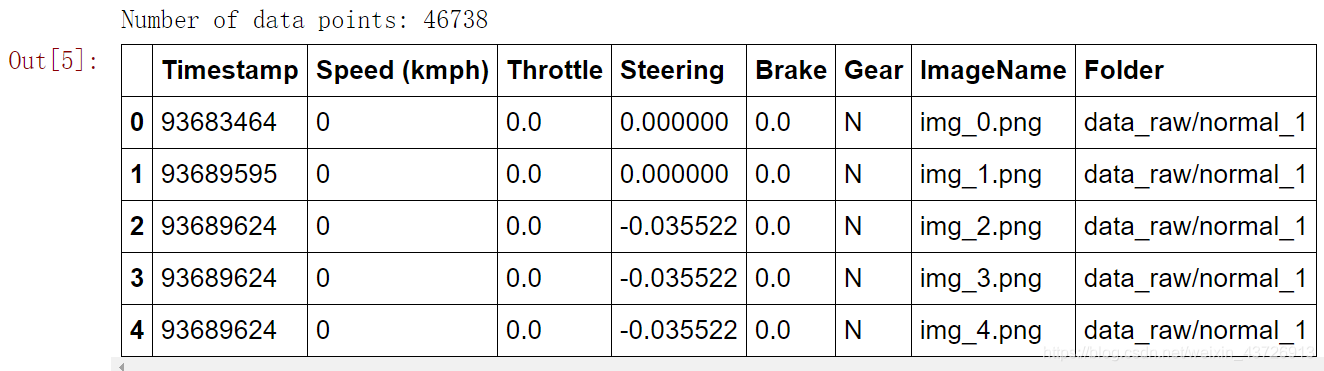
把所有标签放到一个变量中,以更好地观察。
full_path_raw_folders = [os.path.join(RAW_DATA_DIR, f) for f in DATA_FOLDERS]

dataframes = []
for folder in full_path_raw_folders:
    current_dataframe = pd.read_csv(os.path.join(folder, 'airsim_rec.txt'), sep='\t')
    current_dataframe['Folder'] = folder
    dataframes.append(current_dataframe)

dataset = pd.concat(dataframes, axis=0) # 把{list:9}变成1个DataFrame{46738,8}

print('Number of data points: {0}'.format(dataset.shape[0]))

dataset.head()
观察文件夹的命名:‘normal’和‘swerve’两种,这指的是两种不同的驾驶策略,我们看一下二者区别。从每个驾驶风格对彼此绘制数据点的一部分。
min_index = 100
max_index = 1100
steering_angles_normal_1 = dataset[dataset['Folder'].apply(lambda v: 'normal_1' in v)]['Steering'][min_index:max_index] # 这里的写法堪称牛逼
steering_angles_swerve_1 = dataset[dataset['Folder'].apply(lambda v: 'swerve_1' in v)]['Steering'][min_index:max_index]

plot_index = [i for i in range(min_index, max_index, 1)]

fig = plt.figure(figsize=FIGURE_SIZE)
ax1 = fig.add_subplot(111)

ax1.scatter(plot_index, steering_angles_normal_1, c='b', marker='o', label='normal_1')
ax1.scatter(plot_index, steering_angles_swerve_1, c='r', marker='o', label='swerve_1')
plt.legend(loc='upper left');
plt.title('Steering Angles for normal_1 and swerve_1 runs')
plt.xlabel('Time')
plt.ylabel('Steering Angle')
plt.show()
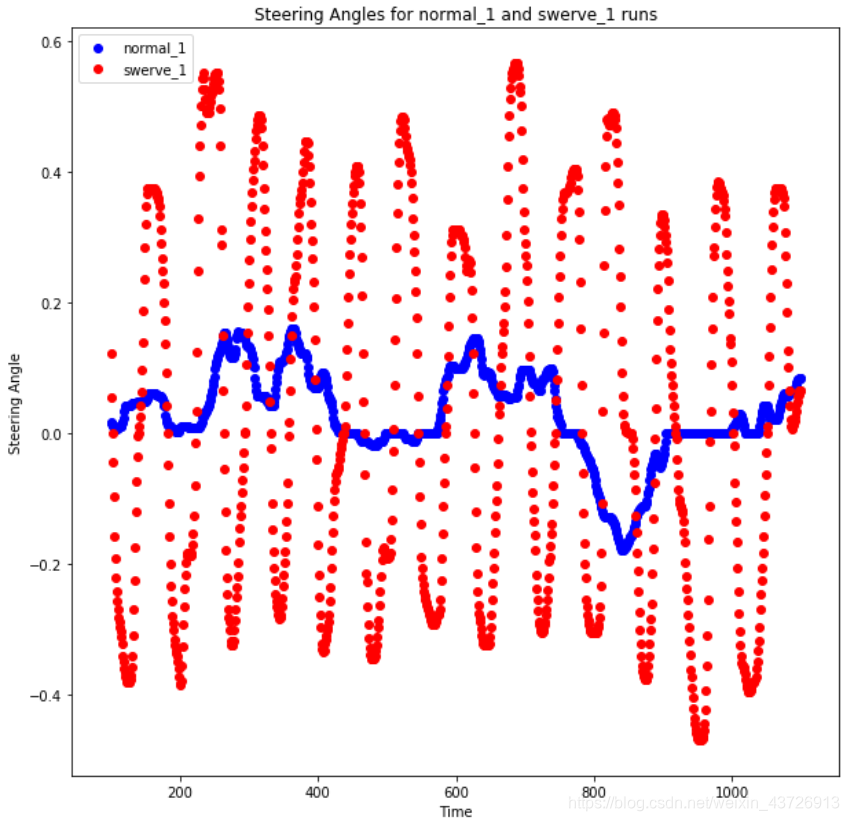
蓝色的点显示的是正常的驾驶策略,转向角度接近于零,车在道路上大部分时间都是直线行驶。
转弯驾驶策略使汽车几乎在道路上左右摇摆。在训练端到端深度学习模型时,由于我们没有做任何特征工程,我们的模型几乎完全依赖数据集来提供它需要的所有必要信息。因此,要考虑到模型可能遇到的任何急转弯,并在它开始偏离道路时给予它纠正自身的能力,我们需要在训练时为它提供足够的这样的例子。因此,我们创建了这些额外的数据集来关注这些场景。
现在,让我们看看每个类别中的数据点数量。
dataset['Is Swerve'] = dataset.apply(lambda r: 'swerve' in r['Folder'], axis=1) # https://www.cnblogs.com/liulangmao/p/9342806.html。直呼内行
grouped = dataset.groupby(by=['Is Swerve']).size().reset_index() # 关于pandas的用法还是太强了。。。
grouped.columns = ['Is Swerve', 'Count']

def make_autopct(values):
    def my_autopct(percent):
        total = sum(values)
        val = int(round(percent*total/100.0))
        return '{0:.2f}%  ({1:d})'.format(percent,val)
    return my_autopct

pie_labels = ['Normal', 'Swerve']
fig, ax = plt.subplots(figsize=FIGURE_SIZE) # 函数返回一个figure图像和子图ax的array列表。https://www.cnblogs.com/komean/p/10670619.html
ax.pie(grouped['Count'], labels=pie_labels, autopct = make_autopct(grouped['Count'])) # https://www.cnblogs.com/biyoulin/p/9565350.html
plt.title('Number of data points per driving strategy')
plt.show()
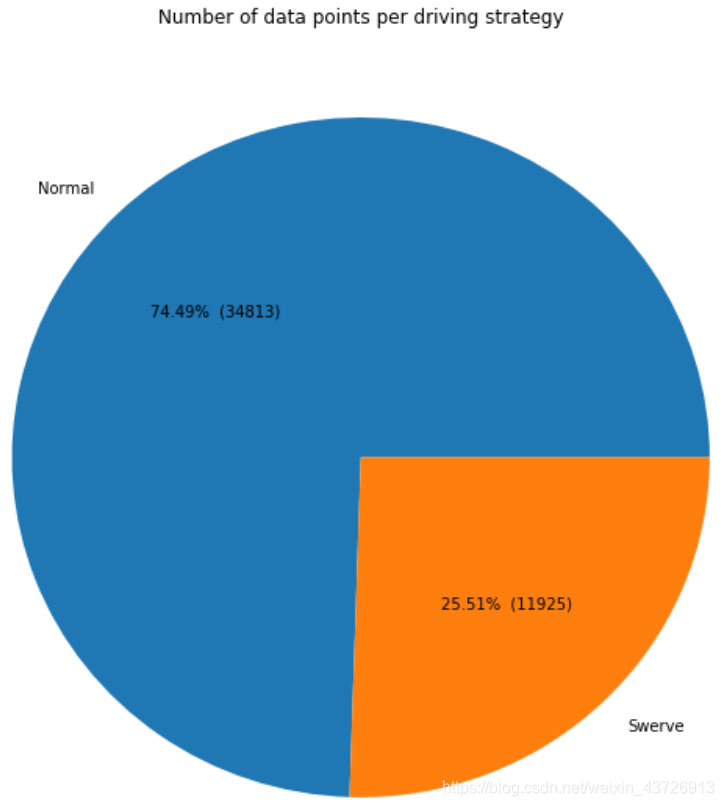
1/4是Swerve数据,剩余的是normal数据,且只有47,000数据,因此网络不能太深。
让我们看看这两种策略下标签的分布情况。
bins = np.arange(-1, 1.05, 0.05)
normal_labels = dataset[dataset['Is Swerve'] == False]['Steering']
swerve_labels = dataset[dataset['Is Swerve'] == True]['Steering']

def steering_histogram(hist_labels, title, color):
    plt.figure(figsize=FIGURE_SIZE)
    n, b, p = plt.hist(hist_labels.as_matrix(), bins, normed=1, facecolor=color) # normed:参数指定密度,也就是每个条状图的占比例比,默认为1
    plt.xlabel('Steering Angle')
    plt.ylabel('Normalized Frequency')
    plt.title(title)
    plt.show()

steering_histogram(normal_labels, 'Normal label distribution', 'g') # https://blog.youkuaiyun.com/weixin_43085694/article/details/104147348
steering_histogram(swerve_labels, 'Swerve label distribution', 'r') # https://blog.youkuaiyun.com/m0_45408211/article/details/107583589
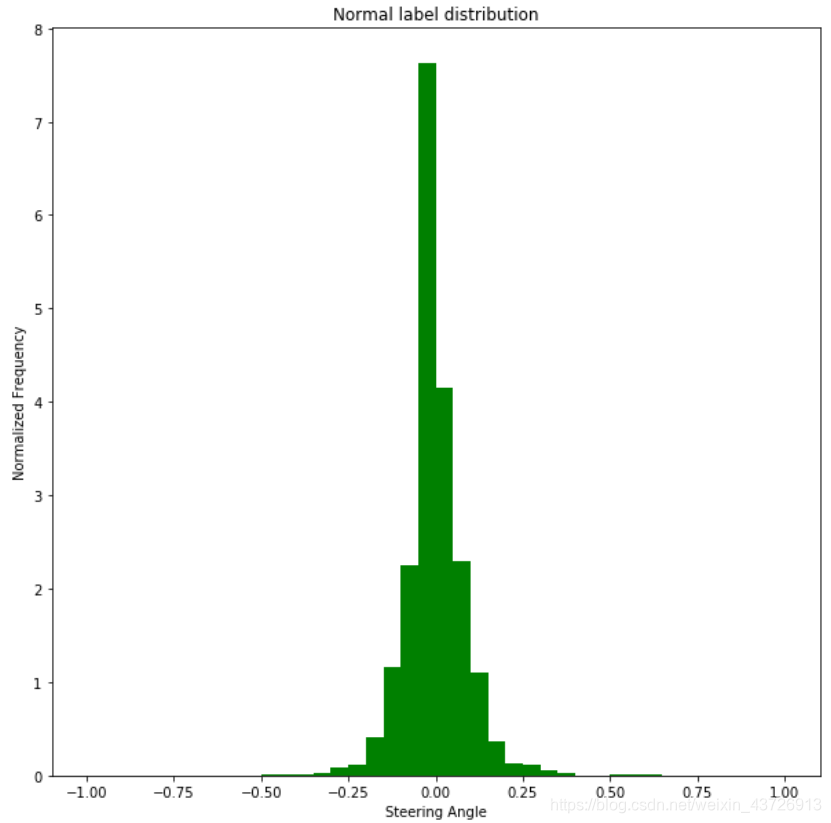
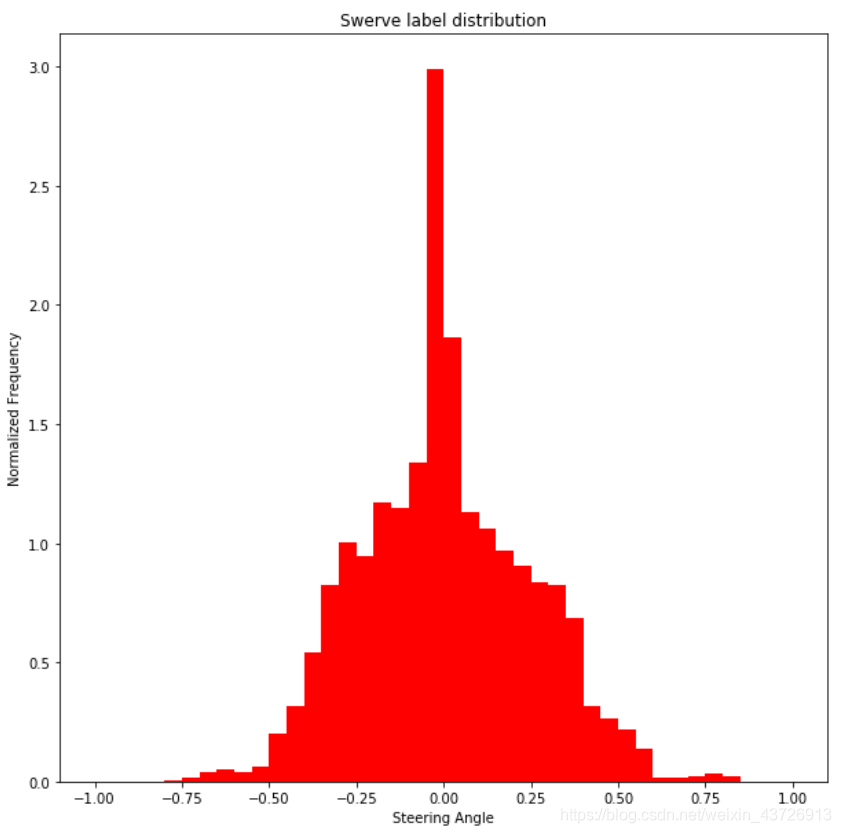
两个结论:
- 汽车正常行驶时,转向角度几乎总是为零。这是一个严重的不平衡,如果这部分数据没有采样,模型将总是预测零,汽车将无法转弯。
- 当使用转向策略驾驶汽车时,我们会得到在正常策略数据集中不会出现的急转弯例子。这验证了我们收集上述数据背后的原因。(将数据集分类normal和swerve两类)
此时,我们需要将原始数据合并成适合训练的压缩数据文件。这里,我们将使用**.h5文件**,因为这种格式非常适合支持大型数据集,而不需要一下子将所有数据都读入内存。它还可以与Keras无缝地工作。
编写数据集的代码很简单,但是很长。当它终止时,最终的数据集将有4部分:
- image:图片数据,numpy array
- previous_state:汽车的最后已知状态,numpy array,(steering, throttle, brake, speed)元组格式。
- label:转角(我们要预测的),归一化到[-1,1]之间,numpy array
- metadata:关于文件的metadata(他们来自哪里等),numpy array
我们把他们分成train/test/validation三部分。
train_eval_test_split = [0.7, 0.2, 0.1]
full_path_raw_folders = [os.path.join(RAW_DATA_DIR, f) for f in DATA_FOLDERS]
Cooking.cook(full_path_raw_folders, COOKED_DATA_DIR, train_eval_test_split)
 上述文件中导入的本地模块
import Cooking解读如下:
import random
import csv
from PIL import Image
import numpy as np
import pandas as pd
import sys
import os
import errno
from collections import OrderedDict
import h5py
from pathlib import Path
import copy
import re

def checkAndCreateDir(full_path):
    """Checks if a given path exists and if not, creates the needed directories.
            Inputs:
                full_path: path to be checked
    """
    if not os.path.exists(os.path.dirname(full_path)):
        try:
            os.makedirs(os.path.dirname(full_path))
        except OSError as exc:  # Guard against race condition
            if exc.errno != errno.EEXIST:
                raise

def readImagesFromPath(image_names):
    """ Takes in a path and a list of image file names to be loaded and returns a list of all loaded images after resize.
           Inputs:
                image_names: list of image names
           Returns:
                List of all loaded and resized images
    """
    returnValue = []
    for image_name in image_names:
        im = Image.open(image_name)
        imArr = np.asarray(im)

        #Remove alpha channel if exists
        if len(imArr.shape) == 3 and imArr.shape[2] == 4: # 如果imArr的形状是3并且通道维度是4的话
            if (np.all(imArr[:, :, 3] == imArr[0, 0, 3])): # 如果所有图像的alpha通道都相等
                imArr = imArr[:,:,0:3] 3 # 移除alpha通道
        if len(imArr.shape) != 3 or imArr.shape[2] != 3:
            print('Error: Image', image_name, 'is not RGB.')
            sys.exit()

        returnIm = np.asarray(imArr)

        returnValue.append(returnIm)
    return returnValue # 返回列表{list:32}。每个元素的形状是【144,256,3】


def splitTrainValidationAndTestData(all_data_mappings, split_ratio=(0.7, 0.2, 0.1)):
    """Simple function to create train, validation and test splits on the data.
            Inputs:
                all_data_mappings: mappings from the entire dataset
                split_ratio: (train, validation, test) split ratio

            Returns:
                train_data_mappings: mappings for training data
                validation_data_mappings: mappings for validation data
                test_data_mappings: mappings for test data

    """
    if round(sum(split_ratio), 5) != 1.0:
        print("Error: Your splitting ratio should add up to 1")
        sys.exit()

    train_split = int(len(all_data_mappings) * split_ratio[0])
    val_split = train_split + int(len(all_data_mappings) * split_ratio[1])

    train_data_mappings = all_data_mappings[0:train_split]
    validation_data_mappings = all_data_mappings[train_split:val_split]
    test_data_mappings = all_data_mappings[val_split:]

    return [train_data_mappings, validation_data_mappings, test_data_mappings]

def generateDataMapAirSim(folders):
    """ Data map generator for simulator(AirSim) data. Reads the driving_log csv file and returns a list of 'center camera image name - label(s)' tuples
           Inputs:
               folders: list of folders to collect data from

           Returns:
               mappings: All data mappings as a dictionary. Key is the image filepath, the values are a 2-tuple:
                   0 -> label(s) as a list of double
                   1 -> previous state as a list of double
    """

    all_mappings = {
   }
    for folder in folders:
        print('Reading data from {0}...'.format(folder))
        current_df = pd.read_csv(os.path.join(folder, 'airsim_rec.txt'), s
最低0.47元/天 解锁文章


 被折叠的 条评论
为什么被折叠?
被折叠的 条评论
为什么被折叠?
 到【灌水乐园】发言


