在vue中使用OpenLayers地图 02 绘制点线面等图形

这篇博客展示了如何在Vue应用中利用OpenLayers库创建交互式地图。通过HTML和Vue方法,实现了地图的初始化、绘制功能的选择(点、线、多边形、圆、正方形、长方形)以及图形绘制的动态更新。用户可以根据下拉菜单选择不同的绘制类型,地图会实时显示所选图形。此外,还提供了清除绘制图形的功能。

摘要生成于 C知道 ,由 DeepSeek-R1 满血版支持, 前往体验 >

参考01中的准备工作

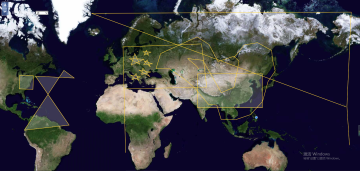
1. 先按照01中流程确定你已经创建出了一个能够正常展示的OL,有环境后可直接cv以下绘图操作 效果如下

  1. 实现效果:

绘制点线面

  1. style样式部分
<!-- 绘制几何图形 -->
  <div id="container">
      <!-- 绘制几何图形 -->
      <div id="menu">
        <label>几何图形类型:&nbsp;</label>
        <select id="type">
          <option value="None"></option>
          <option value="Point"></option>
          <option value="LineString">线</option>
          <option value="Polygon">多边形</option>
          <option value="Circle"></option>
          <option value="Square">正方形</option>
          <option value="Box">长方形</option>
        </select>
      </div>
    </div>
  </div>  
  1. vue方法部分
<script>
import "ol/ol.css";
import ol from "openlayers";
export default {
  methods: {
    // 初始化地图
    initMap() {
      var map = new ol.Map({
        target: "container",
        layers: [
          new ol.layer.Tile({
            source: new ol.source.XYZ({
              url: "http://t0.tianditu.com/DataServer?T=img_w&x={x}&y={y}&l={z}&tk=0c37299462312e175cab9628d29c7563",
            }),
            visible: true,
          }),
        ],
        view: new ol.View({
          center: [0, 0],
          zoom: 3,
        }),
      });

      var typeSelect = document.getElementById("type"); //绘制类型选择对象
      var draw; //ol.Interaction.Draw类的对象

      //实例化一个矢量图层Vector作为绘制层
      var source = new ol.source.Vector();
      var vectorLayer = new ol.layer.Vector({
        source: source,
        style: new ol.style.Style({
          fill: new ol.style.Fill({
            //填充样式
            color: "rgba(255, 255, 255, 0.2",
          }),
          stroke: new ol.style.Stroke({
            //线样式
            color: "#ffcc33",
            width: 2,
          }),
          image: new ol.style.Circle({
            //点样式
            radius: 7,
            fill: new ol.style.Fill({
              color: "#ffcc33",
            }),
          }),
        }),
      });
      //将绘制层添加到地图容器中
      map.addLayer(vectorLayer);

      //用户更改绘制类型触发的事件
      typeSelect.onchange = function (e) {
        map.removeInteraction(draw); //移除绘制图形控件
        addInteraction(); //添加绘制图形控件
      };

      function addInteraction() {
        var typeValue = typeSelect.value; //绘制类型
        if (typeValue !== "None") {
          var geometryFunction, maxPoints;
          if (typeValue === "Square") {
            //正方形
            typeValue = "Circle"; //设置绘制类型为Circle
            //设置几何信息变更函数,即创建正方形
            geometryFunction = ol.interaction.Draw.createRegularPolygon(4);
          } else if (typeValue === "Box") {
            //长方形
            typeValue = "LineString"; //设置绘制类型为LineString
            maxPoints = 2; //设置最大点数为2
            //设置几何信息变更函数,即设置长方形的坐标点
            geometryFunction = function (coordinates, geometry) {
              if (!geometry) {
                geometry = new ol.geom.Polygon(null); //多边形
              }
              var start = coordinates[0];
              var end = coordinates[1];
              geometry.setCoordinates([
                [start, [start[0], end[1]], end, [end[0], start[1]], start],
              ]);
              return geometry;
            };
          }
          console.log(typeValue);
          //实例化图形绘制控件对象并添加到地图容器中
          draw = new ol.interaction.Draw({
            source: source,
            type: typeValue, //几何图形类型
            geometryFunction: geometryFunction, //几何信息变更时的回调函数
            maxPoints: maxPoints, //最大点数
          });
          map.addInteraction(draw);
        } else {
          //清空绘制的图形
          source.clear();
        }
      }
    },

    // 列表模式的路由跳转
    gotoMenu() {
      this.$router.replace("/screenage/Fenbianlv");
    },
  },
  mounted() {
    this.initMap();
  },
};
</script>
### 使用 OpenLayers 渲染地图上的点、线和面 在 Vue 3 和 OpenLayers 的组合中,可以轻松实现地图上点、线和面的渲染。以下是详细的说明以及代码示例。 #### 创建 OpenLayers 地图组件 为了集成 OpenLayersVue 3 项目中,首先需要安装依赖项 `ol`(OpenLayers 库),并创建一个名为 `OpenLayersMap.vue` 的组件[^1]。 ```bash npm install ol ``` #### 初始化地图视图 通过设置基础的地图容器及其初始中心位置和缩放级别来初始化地图: ```javascript import 'ol/ol.css'; import { Map, View } from 'ol'; import TileLayer from 'ol/layer/Tile'; import OSM from 'ol/source.OSM'; export default { name: 'OpenLayersMap', mounted() { this.initMap(); }, methods: { initMap() { const map = new Map({ target: 'map-container', layers: [ new TileLayer({ source: new OSM(), }), ], view: new View({ center: [0, 0], zoom: 2, }), }); window.olMap = map; // 将地图实例挂载到全局变量以便后续操作 } } }; ``` #### 添加点要素 可以通过定义几何对象 `Point` 并将其添加至矢量层中完成点的绘制[^2]: ```javascript import Point from 'ol/geom/Point'; import Feature from 'ol/Feature'; import VectorSource from 'ol/source/Vector'; import VectorLayer from 'ol/layer/Vector'; import Style from 'ol/style/Style'; import Icon from 'ol/style/Icon'; const pointFeature = new Feature({ geometry: new Point([125.6, 10.1]), // 坐标需转换为投影坐标系 EPSG:3857 }); pointFeature.setStyle( new Style({ image: new Icon({ anchor: [0.5, 46], src: 'https://example.com/marker.png', // 替换为实际图标路径 }), }) ); const vectorSource = new VectorSource({ features: [pointFeature], }); const vectorLayer = new VectorLayer({ source: vectorSource, }); window.olMap.addLayer(vectorLayer); ``` #### 添加线要素 对于线条的绘制,则利用 `LineString` 几何类型,并指定样式属性如颜色与宽度[^3]: ```javascript import LineString from 'ol/geom/LineString'; const lineFeature = new Feature({ geometry: new LineString([ [117.283042, 31.86119], [121.687899486, 31.24916171], ]), }); lineFeature.setStyle( new Style({ stroke: new Stroke({ color: '#ffcc33', width: 3, }), }) ); vectorSource.addFeature(lineFeature); // 同一矢量源可重复使用 ``` #### 添加多边形要素 最后,要展示一个多边形区域,采用 `Polygon` 类型构建闭合图形: ```javascript import Polygon from 'ol/geom/Polygon'; const polygonFeature = new Feature({ geometry: new Polygon([ [ [117.283042, 31.86119], [121.687899486, 31.24916171], [120.0, 30.0], [117.283042, 31.86119], ], ]), }); polygonFeature.setStyle( new Style({ fill: new Fill({ color: 'rgba(255, 0, 0, 0.1)', }), stroke: new Stroke({ color: '#ffcc33', width: 2, }), }) ); vectorSource.addFeature(polygonFeature); ``` 以上即完成了基于 OpenLayersVue 3 环境下对点、线、面三种基本地理要素的渲染过程。 ---
评论 2
添加红包

请填写红包祝福语或标题

红包个数最小为10个

红包金额最低5元

当前余额3.43前往充值 >
需支付:10.00
成就一亿技术人!
领取后你会自动成为博主和红包主的粉丝 规则
hope_wisdom
发出的红包
实付
使用余额支付
点击重新获取
扫码支付
钱包余额 0

抵扣说明:

1.余额是钱包充值的虚拟货币,按照1:1的比例进行支付金额的抵扣。
2.余额无法直接购买下载,可以购买VIP、付费专栏及课程。

余额充值