首先做个热身准备:
numpy的eye函数,生成了一个6*6的对角矩阵
sparse将np数组转化成CSR格式的scipy稀疏矩阵,sparse函数只会存储非0元素
import numpy as np
from scipy import sparse
matrix = np.eye(6)
sparse_matrix = sparse.csr_matrix(matrix)
print(matrix )
[[1. 0. 0. 0. 0. 0.]
 [0. 1. 0. 0. 0. 0.]
 [0. 0. 1. 0. 0. 0.]
 [0. 0. 0. 1. 0. 0.]
 [0. 0. 0. 0. 1. 0.]
 [0. 0. 0. 0. 0. 1.]]
print(sparse_matrix)
  (0, 0)	1.0
  (1, 1)	1.0
  (2, 2)	1.0
  (3, 3)	1.0
  (4, 4)	1.0
  (5, 5)	1.0
%matplotlib inline
# 允许jutyper notebook进行内置实时绘图
import matplotlib.pyplot as plt
#生成从-20到20,元素数为10的等差数列
x = np.linspace(-20,20,10)
y = x**3+2*x**2+5*x+5
plt.plot(x,y,marker = "o")
[<matplotlib.lines.Line2D at 0x2294a28f860>]
K最近邻算法
基本原理
新数据点离谁最近,就和谁属于同一类,但若选择最近邻数等于1,就很容易出现“一叶障目,不见泰山”的情况,因此,选择增加近邻个数,与分类中近邻数最多的一类属于一类
应用—在分类中的应用
scikit中的make_blobs方法常被用来生成聚类算法的测试数据,直观地说,make_blobs会根据用户指定的特征数量、中心点数量、范围等来生成几类数据,这些数据可用于测试聚类算法的效果。
sklearn.datasets.make_blobs(n_samples=100, n_features=2,centers=3, cluster_std=1.0, center_box=(-10.0, 10.0), shuffle=True, random_state=None)[source]
- n_samples是待生成的样本的总数。
- n_features是每个样本的特征数。
- centers表示类别数。
- cluster_std表示每个类别的方差,例如我们希望生成2类数据,其中一类比另一类具有更大的方差,可以将cluster_std设置为[1.0,3.0]。
- center_box(pair of floats (min, max)):每个簇的上下限。
- shuffle(boolean):是否将样本打乱。
- random_state(int/RandomState instance /None):指定随机数种子,每个种子生成的序列相同,与minecraft地图种子同理。
二分类问题
from sklearn.datasets import make_blobs#导入数据集生成器
from sklearn.neighbors import KNeighborsClassifier#导入KNN分类器
#import matplotlib.pyplot as plt
from sklearn.model_selection import train_test_split
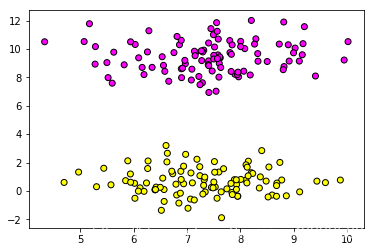
data = make_blobs(n_samples = 200,centers = 2, random_state = 8)
X,y = data
plt.scatter(X[:,0],X[:,1],c=y,cmap = plt.cm.spring,edgecolor = 'k')
scatter函数用法:(https://www.jianshu.com/p/53e49c02c469)
<matplotlib.collections.PathCollection at 0x2294aa8b3c8>
clf = KNeighborsClassifier()#分类器
clf.fit(X,y)#模型训练
KNeighborsClassifier(algorithm='auto', leaf_size=30, metric='minkowski',
           metric_params=None, n_jobs=None, n_neighbors=5, p=2,
           weights='uniform')
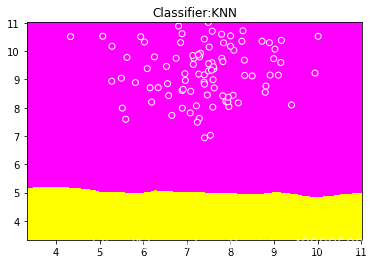
#作图
x_min , x_max = X[:,0].min()-1, X[:,0].max()+1
y_min , y_max = X[:,0].min()-1, X[:,0].max()+1
xx, yy = np.meshgrid(np.arange(x_min,x_max, .02),
                    np.arange(y_min, y_max, .02))
z = clf.predict(np.c_[xx.ravel(),yy.ravel()])
z = z.reshape(xx.shape)
plt.pcolormesh(xx,yy,z, cmap = plt.cm.spring)
plt.scatter(X[:,0],X[:,1],c=y,cmap=plt.cm.spring, edgecolor = 'w')
plt.xlim(xx.min(),xx.max())
plt.ylim(yy.min(),yy.max())
plt.title("Classifier:KNN")
plt.show()
clf.predict([[6.75,4.28]])#测试
array([1])
多分类问题
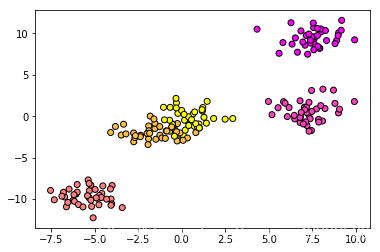
data2 = make_blobs(n_samples = 200,centers = 5, random_state = 8)
X2,y2 = data2
plt.scatter(X2[:,0],X2[:,1],c=y2,cmap = plt.cm.spring,edgecolor = 'k')
clf2 = KNeighborsClassifier()#分类器
clf2.fit(X2,y2)

print("模型正确率:{:.2f}".format(clf2.score(X2,y2)))
模型正确率:0.96
应用—在回归中的应用
#导入用于回归分析的数据集生成器
from sklearn.datasets import make_regression

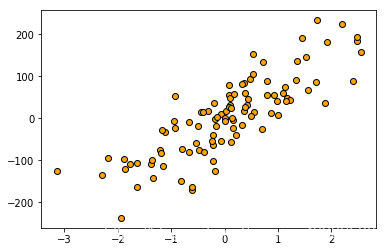
X,y = make_regression(n_features = 1,n_informative = 1,noise = 50,random_state = 8)
plt.scatter(X,y,c='orange',edgecolor = 'k')
<matplotlib.collections.PathCollection at 0x2294b284e10>
from sklearn.neighbors import KNeighborsRegressor
reg = KNeighborsRegressor()
reg.fit(X,y)
z = np.linspace(-3,3,200).reshape(-1,1)
plt.scatter(X,y,c = 'orange',edgecolor = 'k')
plt.plot(z,reg.predict(z),c ='k',linewidth = 3)
[<matplotlib.lines.Line2D at 0x2294b2b3f98>]
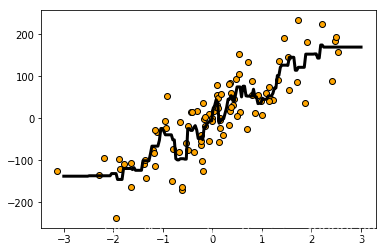
print("模型正确率:{:.2f}".format(reg.score(X,y)))
模型正确率:0.77
在默认情况下,K最近邻算法的n_neighbors为5,由于正确率较低,因此可以将它减少
reg2 = KNeighborsRegressor(n_neighbors = 2)
reg2.fit(X,y)
plt.scatter(X,y,c = 'orange',edgecolor = 'k')
plt.plot(z,reg2.predict(z),c ='k',linewidth = 3)
[<matplotlib.lines.Line2D at 0x2294b336dd8>]
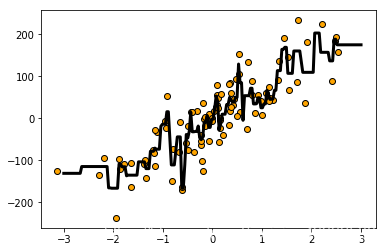
print("模型正确率:{:.2f}".format(reg2.score(X,y)))
模型正确率:0.86
由此可见正确率提高到了0.86,可见有显著提高


 本文介绍了K最近邻算法的基本原理,强调了选择合适的近邻数对于避免误分类的重要性。在分类应用中,通过scikit-learn的make_blobs方法生成测试数据,并探讨了二分类和多分类问题。此外,还讨论了KNN在回归问题中的应用,通过调整n_neighbors参数提高了预测准确率。


 1367
1367

 被折叠的 条评论
为什么被折叠?


