


 本文档介绍了一个使用scipy的minimize函数进行图像识别的案例。首先,通过导入scipy和matplotlib库,加载.mat数据集。数据预处理包括将二维图像数组转换为一维,并调整形状以适应算法。代价函数和梯度下降函数被定义,其中考虑了正则化项。使用TNC方法最小化代价函数,并实现one-vs-all策略来处理多分类问题。最后,定义了预测函数并展示了一个随机图像的识别结果。
1、预先知识学习
1、使用scipy中minimize函数将代价函数最小化
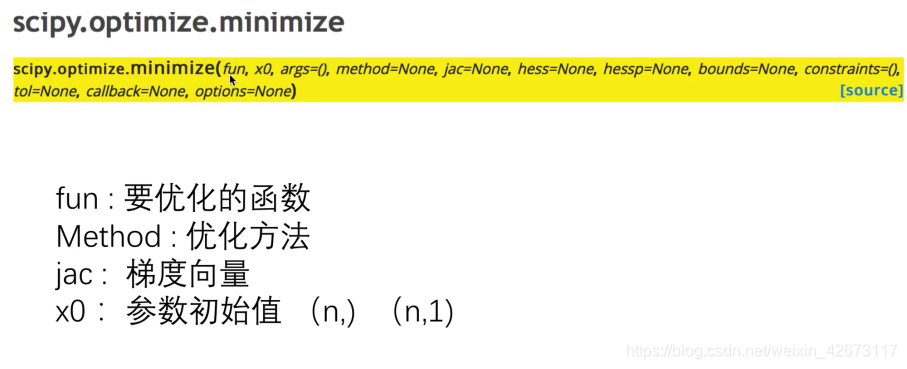
Method有很多种方法:
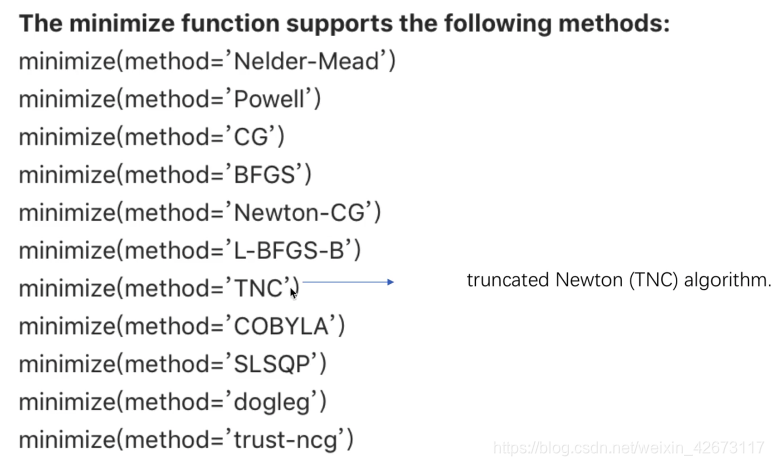
本次使用节段牛顿方法TNC
因为x0是一个二维数组,在使用这个方法时,要求传入一位数组,所以要做一些改动
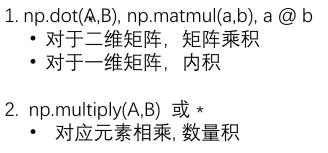
2、矩阵相乘
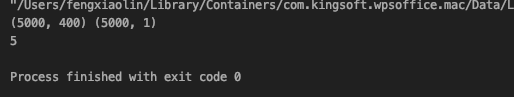
3、注意,在Python中(5000,1)是二维数组,而(5000,)才是一位数组
(5000,1):[[10]
[10]
[10]
…c
[ 9]
[ 9]
[ 9]]
(5000,):[10 10 10 … 9 9 9]
一位转二维:y.reshape(5000,1)
二维转一维:y=y.flatten()
2、题目:
题目:根据学生的俩门学习成绩,预测该学生能否会被大学录取
3、解题
1、导入数据
.mat数据使用
import scipy.io as sio
导入
data = sio.loadmat(path)
X = data['X']
y = data['y']
print(X.shape,y.shape)
通过print可以看出,此类型为字典类型,可以通过data[‘X’]调入X等,通过shape查看数据维度
可以看出,X的维度是400的,是将20*20的照片拉伸成了一维的
2、打印图片
随机打印一张图片:
def plot_an_image(X):
    pick_one = np.random.randint(5000)#取一个随机数
    image = X[pick_one,:]#将这一行数据取出
    fig,ax = plt.subplots(figsize=(1,1))#绘制图像,指定图像大小
    ax.imshow(image.reshape(20,20).T,cmap='gray_r')#维度重新规划,并制定底色和字色
    plt.xticks([])#指定刻度为空,去掉刻度
    plt.yticks([])
    plt.show()
随机打印100张图片:
def plot_100_image(X):
    sample_index = np.random.choice(len(X),100)
    images = X[sample_index,:]
    fig,ax = plt.subplots(ncols=10,nrows=10,figsize=(8,8),sharex=True,sharey=True)
    plt.xticks([])
    plt.yticks([])
    for r in range(10):
        for c in range(10):
	ax[r,c].imshow(images[10*r+c].reshape(20,20).T,cmap='gray_r')
    plt.show()
3、解题:
1、sigmoid函数不变,直接引入
def sigmoid(z):
    return 1/(1+np.exp(-z))
2、代价函数
(1)需要将theta放在参数第一个
(2)因为现在theta是一位数组,所以theta的平方就是做内积,就是一个数值
def costFunction(theta,X,y,lamda):
    A = sigmoid(X@theta)
    first = y*np.log(A)
    second = (1-y)*np.log(1-A)
   # reg = np.sum(np.power(theta[1:],2))*(lamda/(2*len(X))) #正则化项
    #因为现在theta是一位数组,所以theta的平方就是做内积,就是一个数值,theta[1:] @ theta[1:]与np.sum(np.power(theta[1:],2))等价但是前者应该运算速度更快一些
    reg = theta[1:] @ theta[1:] *(lamda/(2*len(X)))
    return -np.sum(first+second)/len(X)+reg
3、梯度下降函数(指定梯度)
#梯度向量
def gradient_reg(theta,X,y,lamda):
    A = sigmoid(X@theta)

    reg = theta[1:] * (lamda/len(X))#
    reg = np.insert(reg,0,values=0,axis=0)#因为theta是从1开始的,所以要加入一行

    first = (X.T@(A-y))/len(X)#梯度向量

    return first+reg
#Xm默认插入一列全为1,用于计算theta[0]
X = np.insert(X,0,values=1,axis=1)

#因为X的维度发生了变化,所以y要变为一位数组
y = y.flatten()
#print(y.shape)
4、使用minimize函数进行运算
#K表示分为几类,此时有0-9十个分类,所以K=10
def one_vs_all(X,y,lamda,K):
    n=X.shape[1]#表示第二维度值,用于确定theta的维度,此处n=401,表示每个数据都有401个特征值
    theta_all = np.zeros((K,n))#初始化theta,对于每一个特征值都要确定一个theta,表示
    for i in range(1,K+1):
        theta_i = np.zeros(n,)#确定每一个
        res = so.minimize(fun=costFunction,
                          x0=theta_i,
                          args=(X,y==i,lamda),
                          method='TNC',
                          jac=gradient_reg)
        theta_all[i-1,:]=res.x
    return theta_all
5、预测函数(输入一个数据然后预测是哪一个数字)
#预测函数
def predict(X,theta_final):
    h = sigmoid(X@theta_final.T) #因为X此时的维度是(5000,401),而theta_final是(10,401),最终应该是(5000,10)
    h_argmax = np.argmax(h)#0代表行,1代表列,沿着每一列去比较
    #argmax返回这一列最大值的索引,比如第一个最大返回0
    return h_argmax+1
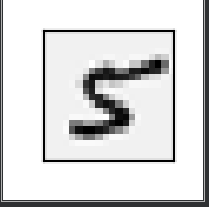
5、实现输出一个图片然后对其识别(自行实现):
(1)输出一张图片
注意:要在对X插入ones列之前输出,否则401无法reshape成20*20
def plot_an_image(X,num):
    image = X[num]#将这一行数据取出
    fig,ax = plt.subplots(figsize=(1,1))#绘制图像,指定图像大小
    ax.imshow(image.reshape(20,20).T,cmap='gray_r')#维度重新规划,并制定底色和字色
    plt.xticks([])#指定刻度为空,去掉刻度
    plt.yticks([])
    plt.show()
# plot_an_image(X)
pick_one = np.random.randint(5000)#取一个随机数
plot_an_image(X,pick_one)
(2)调用函数对其进行识别
print(predict(X[pick_one],theta_final))
效果:


 3554
3554

 被折叠的 条评论
为什么被折叠?
被折叠的 条评论
为什么被折叠?
 到【灌水乐园】发言


