var colorList = [
"rgba(0, 138, 255, 1)",
"rgba(255, 155, 48, 1)",
"rgba(0, 180, 76, 1)",
"rgba(151, 101, 254, 1)",
];
var colorLabelTitle = [
"rgb(121, 240, 182)",
"rgb(186, 206, 246)",
"rgb(141, 204, 241)",
"rgb(250, 220, 135)",
];
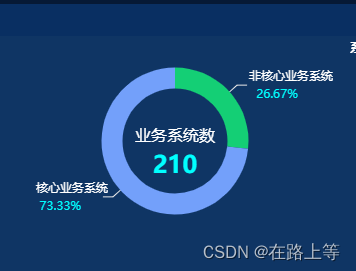
var echartData = [
{
value: 56,
name: "非核心业务系统",
},
{
value: 154,
name: " 核心业务系统",
}
];
//把echartData数据遍历实现不同指线文字背景色
var seriesData = echartData.map((item, index) => {
let obj ={
...item,
actValue: item.value,
label: {
show: true,
position: "outside",
borderRadius: 5,
padding: [10, -10, 3, -3],
color: colorList[index],
textStyle: {
fontSize: 15,
},
formatter:
"{white|{b}}\n{three| {d}%} ",
rich: {
test: {},
white: {
align: "left",
color: "#fff",
},
three: {
color: "#00ffff",
align: "left",
padding: [6, 0],
// fontSize: fontSize * 1.6,
},
},
},
};
console.log(obj)
return obj
});
const optionRing = {
title: {
show: true,
text: '业务系统数',
subtext: echartData && echartData.reduce((prev, cur) => {
return prev + Number(cur.value);
}, 0) + "",
textStyle: {
color: "#ffffff",
fontSize: 16,
fontWeight: 400,
align: "center",
},
subtextStyle: {
fontSize: 24,
color: "#00ffff",
fontWeight: 700,
},
x: "center",
y: "42%",
},
legend: {
show: false
},
tooltip: {
show: false,
// trigger: "item",
// formatter: "{b}<br/>{c} ({d}%)",
// textStyle: {
// fontSize: fontSize * 1.6,
// },
},
series: [
{
name: "pie",
type: "pie",
radius: ["50%", "70%"],
hoverAnimation: false,
color: ["#14cf75", "#73a0fa"],
// itemStyle: {
// //饼图之间颜色
// show:false,
// normal: {
// // borderColor: "#fff",
// borderWidth: 4,
// },
// },
labelLine: {
length: 10,//视觉引导线第一段的长度
length2: 10,//视觉引导线第二段的长度
lineStyle: {
color: "#e9e9e9" // 改变标示线的颜色
}
},
data: seriesData,
},
],
}


 797
797

 被折叠的 条评论
为什么被折叠?
被折叠的 条评论
为什么被折叠?
 到【灌水乐园】发言


