// 系统上云率
const optionBar = {
title: {
text: '系统上云率',
left: 'left',
textStyle: {
color: "#fff",
fontSize: 14,
fontWeight: 650,
align: "center",
},
},
color: ['#32C5FF', '#00F766', '#EECB5F'],
grid: {
top: 40,
bottom: 0,
},
legend: { // 控制图例组件
show: false
},
xAxis: {
show: true,
// 类目轴
type: "category",
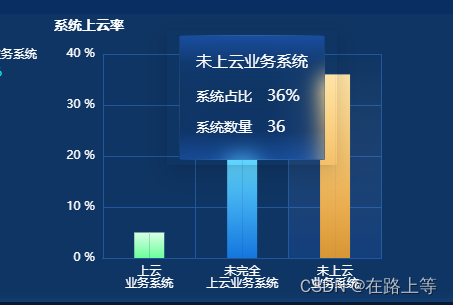
data: ['上云,业务系统', '未完全,上云业务系统', '未上云,业务系统'],
axisTick: {
show: false //隐藏X轴刻度
},
splitLine: {
show: true,
lineStyle: {
color: ['#20579E'],
width: 1,
type: 'solid'
},
},
axisLine: {
lineStyle: {
color: "#20579E"
}
},
axisLabel: {
interval: 0,
color: "#fff",
formatter: function (value, index) {
console.log(`${value.split(",")[0]}\n${+ value.split(",")[1]}`);
// return "{b|" + value.split(",")[0] + "}\n{b|" + value.split(",")[1] + "}";
return `${value.split(",")[0]}\n${value.split(",")[1]?value.split(",")[1]:""}`
},
},
},
yAxis: {
type: 'value',
splitLine: {
show: true,
lineStyle: {
color: ['#20579E'], //y轴线的颜色
width: 1,
type: 'solid'
},
},
axisLabel: {
color: '#fff',// y轴字体颜色
formatter: '{value} %'
},
},
tooltip: {
trigger: 'axis',
axisPointer: {
type: 'shadow',
shadowStyle: {
color: new echarts.graphic.LinearGradient(
0, 0, 0, 1,
[
{ offset: 0, color: 'rgba(255, 255, 255, 0)' },
{ offset: 1, color: 'rgba(37, 107, 230, 0.18)' }
]
),
}
},
backgroundColor: 'rgba(50,50,50,0)', // tooltip默认背景为白色,手动置为透明
borderWidth: 0,
formatter: function (params) {
let html = '';
html += `<div style="color: #fff;font-size: 16px;height: 125px;padding: 16px;
background: linear-gradient(180deg, rgba(37,108,233,0.44) 0%, rgba(23,80,169,0.1) 22%, rgba(20,64,137,0) 46%, rgba(16,51,111,0.28) 77%, rgba(30,101,213,0.4) 100%);
border-radius: 2px;border: 1px solid;border-image: radial-gradient(circle, rgba(111, 185, 242, 0.86), rgba(0, 0, 0, 0.2)) 1 1;
backdrop-filter: blur(10px);">
<div>
<div style="margin-bottom: 16px">${params[0].name.replace(',', '')}</div>
<div style="margin-bottom: 12px">
<span style="display:inline-block;margin-right:4px;border:1px solid #fff;border-radius:10px;width:10px;height:10px;background-color:#0CC8E6;"></span>
<span style="font-size: 14px;">${params[0].seriesName}</span>
<span style="margin-left: 16px;color: #0CC8E6;">${params[0].value}</span>
</div>
<div>
<span style="display:inline-block;margin-right:4px;border:1px solid #fff;border-radius:10px;width:10px;height:10px;background-color:#08BA57;"></span>
<span style="font-size: 14px;">${params[1].seriesName}</span>
<span style="margin-left: 16px;color: #08BA57;font-weight: bold;">${params[1].value}</span>
</div>
</div>
</div>`;
return html
},
},
};
const dataBar = {
seriesData: [
{
name: "系统占比",
// barCategoryGap: '50%',
barWidth: 15,
data: [
{
value: 5,
itemStyle: {
// color: '#37D8FF',
color: new echarts.graphic.LinearGradient(0, 0, 0, 1, [
{ offset: 0, color: "#D9FFE5" },
{ offset: 1, color: "#6BFF9B" }
])
}
},
{
value: 20,
itemStyle: {
color: new echarts.graphic.LinearGradient(0, 0, 0, 1, [
{ offset: 0, color: "#64DAFF" },
{ offset: 1, color: "#1476DE" }
])
}
},
{
value: 36,
itemStyle: {
color: new echarts.graphic.LinearGradient(0, 0, 0, 1, [
{ offset: 0, color: "#FFD097" },
{ offset: 1, color: "#FF910C" }
])
}
}
]
},
{
name: "系统数量",
barWidth: 15,
// barCategoryGap: '50%',
data: [
{
value: 5,
itemStyle: {
show: false,
color: new echarts.graphic.LinearGradient(0, 0, 0, 1, [
{ offset: 0, color: "#D9FFE5" },
{ offset: 1, color: "#6BFF9B" }
])
}
},
{
value: 20,
itemStyle: {
show: false,
color: new echarts.graphic.LinearGradient(0, 0, 0, 1, [
{ offset: 0, color: "#64DAFF" },
{ offset: 1, color: "#1476DE" }
])
// color: '#00F766'
}
},
{
value: 36,
itemStyle: {
color: new echarts.graphic.LinearGradient(0, 0, 0, 1, [
{ offset: 0, color: "#FFD097" },
{ offset: 1, color: "#FF910C" }
])
}
}
]
}
]
}


 被折叠的 条评论
为什么被折叠?
被折叠的 条评论
为什么被折叠?
 到【灌水乐园】发言


