


环境:ubuntu16.04,python2.7.12
版本:networkx==2.2, matplotlib==1.5.1, numpy==1.11.0
创建图
import networkx as nx
graph = nx.DiGraph()
节点
添加节点:
graph.add_node(1)
graph.add_node(2, value=float('inf'))
查看节点属性:
graph.node[2]返回{'value': inf},为dict类型。
修改/添加节点属性:
graph.node[2]['value'] = 7遍历节点:
graph.node(data=True)
graph.nodes(data=True)
结果均为:
[(1, {}), (2, {'value': 7})]
边
添加边:
graph.add_edge(1, 2, weight=9.0)查看边属性:
graph[1][2]['weight']修改/添加节点属性:
graph[1][2]['length'] = 10遍历边:
graph.edges(data=True)结果为
[(1, 2, {'length': 10, 'weight': 9.0})]
可视化
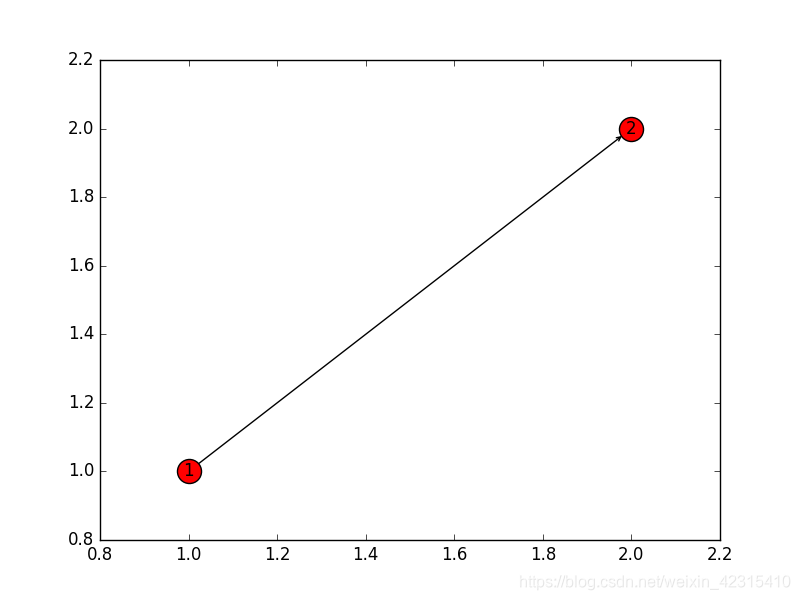
若指定节点位置,需首先给出位置dict:
keys = [node for index, node in enumerate(graph.nodes)]
positions = np.array([(1,1), (2,2)])
pos = dict(zip(keys, positions))
其次:
edge_width = 1.0

nx.draw_networkx_nodes(graph, pos)
nx.draw_networkx_labels(graph, pos)
nx.draw_networkx_edges(graph, pos, width=edge_width, arrowstyle='->')

plt.show()
效果:
- 不指定节点位置:
pos = nx.spring_layout(graph)其中,spring_layout可替换。
- 根据边权重改变边的粗细:
edge_width = [float(d['weight']*1.0) for (u,v,d) in graph.edges(data=True)]- 显示边的属性:
edge_labels = dict([((u,v,),d['weight']) for u,v,d in graph.edges(data=True)])
nx.draw_networkx_edge_labels(graph, pos, edge_labels=edge_labels)
效果:

附(源码)
import networkx as nx
import matplotlib.pyplot as plt
import numpy as np


graph = nx.DiGraph()

graph.add_node(1)
graph.add_node(2, value=float('inf'))
graph.node[2]['value'] = 7

graph.add_edge(1, 2, weight=9.0)
graph[1][2]['length'] = 10


keys = [node for index, node in enumerate(graph.nodes)]
positions = np.array([(1,1), (2,2)])
pos = dict(zip(keys, positions))

edge_width = 1.0

nx.draw_networkx_nodes(graph, pos)
nx.draw_networkx_labels(graph, pos)
nx.draw_networkx_edges(graph, pos, width=edge_width, arrowstyle='->')

edge_labels = dict([((u,v,),d['weight']) for u,v,d in graph.edges(data=True)])
nx.draw_networkx_edge_labels(graph, pos, edge_labels=edge_labels)

plt.show()


 被折叠的 条评论
为什么被折叠?
被折叠的 条评论
为什么被折叠?
 到【灌水乐园】发言


