


文档
https://matplotlib.org/stable/index.html
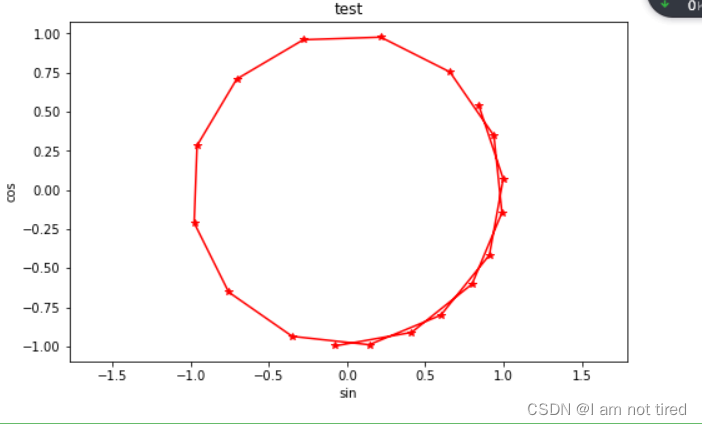
简单入门
import matplotlib.pyplot as plt
import numpy as np
t=np.arange(1,10,0.5)#利用numpy生成随机数
x=np.sin(t)#生成x轴数据
y=np.cos(t)#生成y轴数据
plt.figure(figsize=(8,5))
plt.plot(x,y,"r-*")
plt.axis("equal")
plt.xlabel("sin")
plt.ylabel("cos")
plt.title("test")
plt.show()
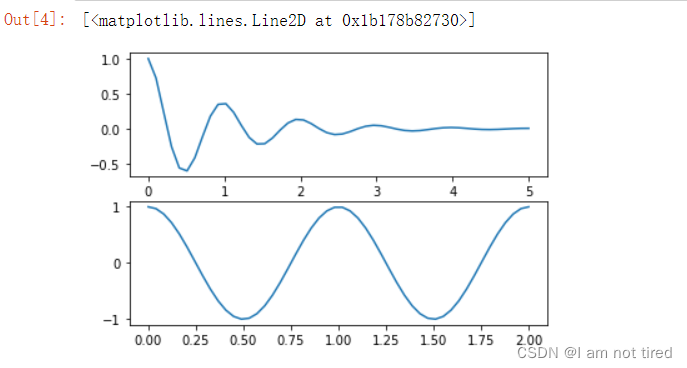
绘制线图
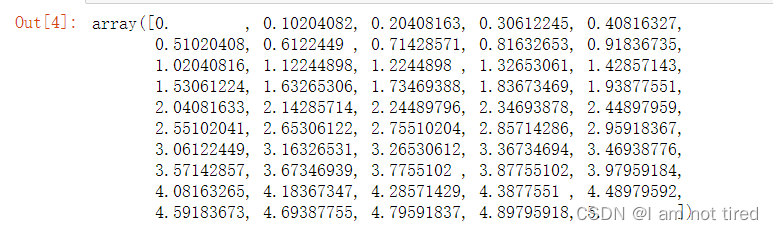
x1=np.linspace(0.0,5.0)
x1
import matplotlib.pyplot as plt
import numpy as np

#生成x坐标
x1=np.linspace(0.0,5.0)
x2=np.linspace(0.0,2.0)

#生成y坐标
y1=np.cos(2*np.pi*x1)*np.exp(-x1)
y2=np.cos(2*np.pi*x2)

plt.subplot(2,1,1)#生成一个两行一列的图,最后参数1代表是第一个图
plt.plot(x1,y1)
plt.subplot(2,1,2)
plt.plot(x2,y2)
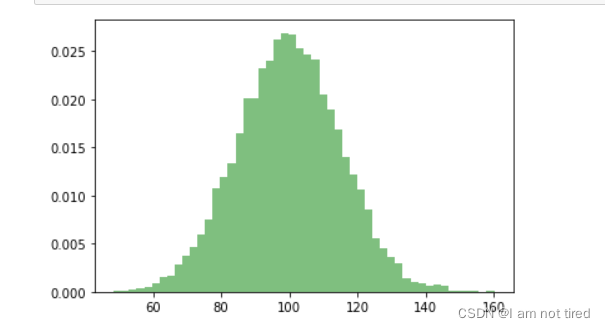
绘制柱状图
import matplotlib.pyplot as plt
import numpy as np
import matplotlib.mlab as mlab
mu=100
sigma=15
x=mu+sigma*np.random.randn(10000)

num_bins=50 #直方图条数
#绘制直方图
n,bins,patches=plt.hist(x,num_bins,density=1,facecolor='green',alpha=0.5)
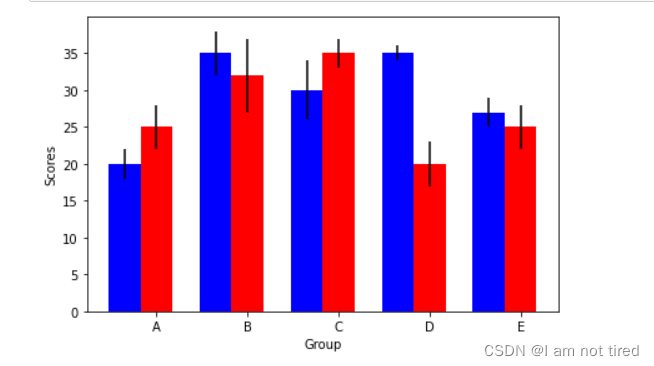
绘制条状图
import matplotlib.pyplot as plt
import numpy as np
import matplotlib.mlab as mlab

#生成需要的数据
n_groups=5
means_men=(20,35,30,35,27)
std_men=(2,3,4,1,2)
means_women=(25,32,35,20,25)
std_women=(3,5,2,3,3)

fig,ax=plt.subplots()
index=np.arange(n_groups) #index=[(0,1,2,3,4)]
bar_width=0.35

opacity=0.4
error_config={'ecolor':0.3}

rects1=plt.bar(index,means_men,bar_width,color='b',yerr=std_men)  #第一个条状
rects2=plt.bar(index+bar_width,means_women,bar_width,color='r',yerr=std_women)

plt.xlabel('Group')
plt.ylabel('Scores')
plt.xticks(index+bar_width,('A','B','C','D','E'))

plt.tight_layout()
plt.show()
官方文档:https://matplotlib.org/stable/api/_as_gen/matplotlib.pyplot.bar.html#matplotlib.pyplot.bar
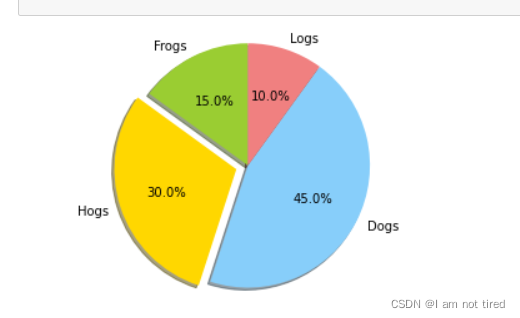
绘制饼状图
import matplotlib.pyplot as plt
import numpy as np

labels='Frogs','Hogs','Dogs','Logs'
sizes=[15,30,45,10]
colors=['yellowgreen','gold','lightskyblue','lightcoral']
explode=(0,0.1,0,0) #用于指定偏移每个楔块的半径分数
plt.pie(sizes,explode=explode,labels=labels,colors=colors,autopct='%1.1f%%',shadow=True,startangle=90)
plt.axis('equal')
plt.show()
官方文档:https://matplotlib.org/stable/api/_as_gen/matplotlib.pyplot.pie.html


 被折叠的 条评论
为什么被折叠?
被折叠的 条评论
为什么被折叠?
 到【灌水乐园】发言


