 ECharts折线图实战


 本文详细介绍使用ECharts创建折线图的过程,包括JS引用、图标展示、数据加载及图表初始化,适合初学者快速上手。
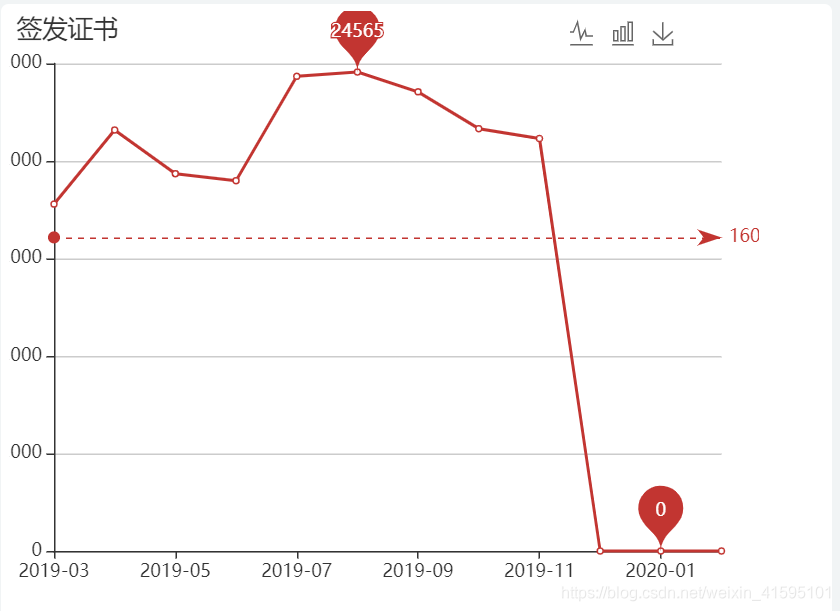
先上一下效果图:
echarts官网特别详细:
配置项讲解:https://www.echartsjs.com/zh/option.html#series-line
官方示例:https://www.echartsjs.com/examples/zh/index.html
我们直接可以在官网网站利用线程的图形进行修改使用。
接下来我分享一下我这次的折线图制作流程:
代码开发基本就是前台业务数据的获取以及echarts图形样式的确立:
第一步:js引用: 网上直接下载:“echarts.min.js”即可。
第二步:展示图标位置块:
<div class="col-sm-12">
   <div class="col-sm-12 padding-5 margin-bottom-5" style="height: 51%; background-color:#ffffff;border-radius:5px">
      <div class="card">
         <div class="card-body" style="width: 500px;height: 400px" id="container"></div>
      </div>
   </div>
</div>
第三步:初始化数据:
var monthList;
var numList;
function loadEcharts(){
   $.get(ctx + '/mainPage/warning/getEchartsDate.shtml',function(data){
      if(data){
         monthList = data.monthList.reverse();//月份
         numList = data.numList.reverse();//月份对应数据
         initEcharts();初始化echarts容器
      }
   });
};
第四步:初始化echarts容器:
function initEcharts() {
   var option =null;
    option = {
      //标题
      title: {
         text: '签发证书',
         textStyle: {
            fontSize: 17,
            fontWeight: 'normal',
         }
      },
         // 数据提示框样式
         tooltip: {
            trigger: 'axis',//触发类型,item数据项图形触发,axis坐标轴触发
            extraCssText: 'width:200px;heigth:60px;'
         },
         grid: {//直角坐标系网格自定义
            x: 30, //宽
            y: 35, //高
            bottom: '10%',
            right: '5%'
         },
         legend: {//   图例
            data: ['']
         },
         toolbox: {//工具栏
            show: true,
            feature: {
               magicType: {type: ['line', 'bar']},//动态类型切换
               saveAsImage: {}//保存为图片
            },
            right: 50
         },
         xAxis: {//直角坐标系 grid 中的 x 轴
            type: 'category',//坐标轴类型:类目轴
            boundaryGap: false,//坐标轴留白
            left: 0,
            right: 0,
            data: monthList//数据
         },
         yAxis: {//  纵坐标
            type: 'value',
            axisLabel: {
               formatter: '{value}'
            }
         },
         series: [
            {
               name: '本月签发证书',
               type: 'line',//折线图
               data: numList,
               markPoint: {//图表标注
                  data: [
                     {type: 'max', name: '最大值'},
                     {type: 'min', name: '最小值'}
                  ]
               },
               markLine: {
                  data: [
                     {type: 'average', name: '平均值'}
                  ]
               }
            }
         ]
      };
   if (option && typeof option === "object") {
      myChart.setOption(option, true);
}
}
第五步:基于准备好的dom,初始化echarts实例:
var dom = document.getElementById("container");
var myChart = echarts.init(dom);
window.onresize = function(){
myChart.resize();
}
上面五步就是最简单的echarts实现。大家有什么疑问多去官网查资料。官网里真的是什么都有,而且很详细。
再贴一下官网网址:https://www.echartsjs.com/examples/zh/index.html。


 1万+
1万+

 被折叠的 条评论
为什么被折叠?
被折叠的 条评论
为什么被折叠?
 到【灌水乐园】发言


