


1.中文乱码
2.坐标轴标注
3.设置图片大小
4.保存图片
import numpy as np
from matplotlib import pyplot as plt
plt.rcParams['font.sans-serif']=['SimHei'] # 用来正常显示中文标签
plt.rcParams['axes.unicode_minus']=False # 用来正常显示负号
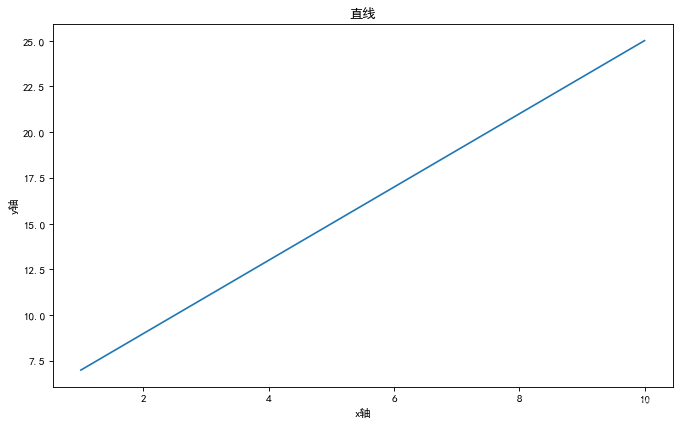
x = np.arange(1,11)
y = 2*x+5
plt.figure(figsize=(10,6), dpi=80)
plt.title('直线')
plt.xlabel('x轴')
plt.ylabel('y轴')
plt.xticks
plt.plot(x,y)
plt.savefig('testmatplotlib.png',dpi=300)
plt.show()
# from matplotlib import pyplot as plt
# import matplotlib
# a=sorted([f.name for f in matplotlib.font_manager.fontManager.ttflist])

# for i in a:
#     print(i)
plt.rcParams['font.sans-serif']=['SimHei'] # 用来正常显示中文标签
plt.rcParams['axes.unicode_minus']=False # 用来正常显示负号
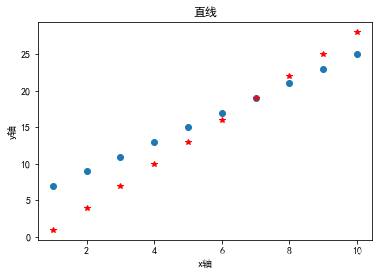
x = np.arange(1,11)
y = 2*x+5
y2 = 3*x-2
plt.title('直线')
plt.xlabel('x轴')
plt.ylabel('y轴')
plt.plot(x,y,'o')
plt.plot(x,y2,'*r')
plt.show()
plt.rcParams['font.sans-serif']=['SimHei'] # 用来正常显示中文标签
plt.rcParams['axes.unicode_minus']=False # 用来正常显示负号
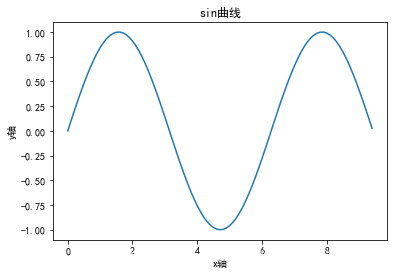
x = np.arange(0,3*np.pi,0.1)
y = np.sin(x)
plt.xlabel('x轴')
plt.ylabel('y轴')
plt.title('sin曲线')
plt.plot(x,y)
plt.show()
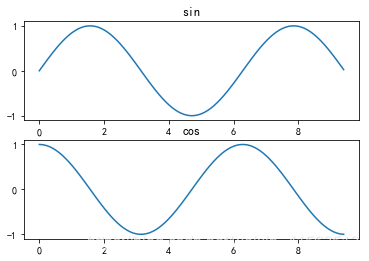
x = np.arange(0,3*np.pi,0.1)
y_sin = np.sin(x)
y_cos = np.cos(x)
plt.subplot(2,1,1)
plt.plot(x,y_sin)
plt.title('sin')
plt.subplot(2,1,2)
plt.plot(x,y_cos)
plt.title('cos')
plt.show()
x =  [5,8,10]
y =  [12,16,6]
x2 =  [6,9,11]
y2 =  [6,15,7]
plt.bar(x,y)
plt.bar(x2,y2,color='r')
plt.show()

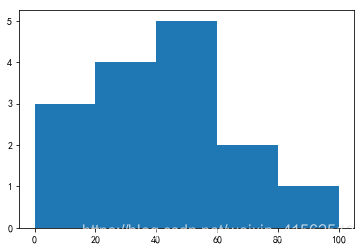
频数分布直方图
a = np.array([22,87,5,43,56,73,55,54,11,20,51,5,79,31,27])
np.histogram(a,bins=[0,20,40,60,80,100])
hist,bins = np.histogram(a,bins = [0,20,40,60,80,100])
print(hist)
print(bins)
plt.hist(a,bins = bins)
plt.show()
[3 4 5 2 1]
[  0  20  40  60  80 100]


 1099
1099

 被折叠的 条评论
为什么被折叠?
被折叠的 条评论
为什么被折叠?
 到【灌水乐园】发言


