


目录
7.监听地图上的坐标点的鼠标滑过事件,并为其添加一个popup框
1.页面初始化加载地图
      <div class="map" id="map"></div>

      onMounted(() => {
            group.map = new ol.Map({
                target: "map",
                layers: [
                    new ol.layer.Tile({
                        source: new ol.source.XYZ({
                            //地图瓦片地址
                            url: "http://192.168.1.3:8080/gaode/roadmap/{z}/{x}/{y}.png",
                        }),
                    }),
                ],
                view: new ol.View({
                    projection: "EPSG:4326",
                    center: [113.56,38.88],  //地图中心点
                    zoom: 7,   //地图缩放比例
                }),
            });

        });
坐标点的基本信息:
        //vue3的写法,mapData为坐标点信息
           let group = reactive({
            mapData: [],
            map: {},
            features: [],
            layers:[],
            popData: null,
            mouseLon: null,
            mouseLat: null,
            zoom: null,
            mapData:[{
                        NAME: '坐标点1',
                        LONGITUDE: 101.877771,
                        LATITUDE: 36.433518
                    },
                    {
                        NAME: '坐标点2',
                        LONGITUDE: 100.69129,
                        LATITUDE: 36.59583
                    }
                ]
             })
2.渲染圆点到地图上
               group.mapData.forEach((element) => {
                //在feature中添加坐标点的一些基本信息
                  let feature = new ol.Feature({
                    title: element.NAME,
                    data: element,
                    geometry: new ol.geom.Point([
                        element.LONGITUDE,
                        element.LATITUDE,
                    ]),
                });
                feature.setStyle(new ol.style.Style({
                   //添加坐标点
                    image: new ol.style.Circle({
                        fill: new ol.style.Fill({
                              color: "red",
                         }),
                        radius: 10,
                     }),
                   }));
                  let source = new ol.source.Vector();
                  source.addFeature(feature);
                  let layer = new ol.layer.Vector();
                  layer.setSource(source);
                  group.map.addLayer(layer);
                });
页面效果: 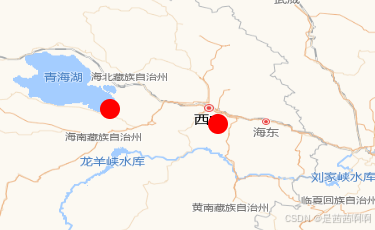
3.渲染自定义图片坐标点到地图上
               group.mapData.forEach((element) => {
                //在feature中添加坐标点的一些基本信息
                  let feature = new ol.Feature({
                    title: element.NAME,
                    data: element,
                    geometry: new ol.geom.Point([
                        element.LONGITUDE,
                        element.LATITUDE,
                    ]),
                });
                feature.setStyle(new ol.style.Style({
                   //添加文字及其样式
                    text: new ol.style.Text({
                        text: element.NAME,
                        offsetY: -30,
                        font: '12px Calibri,sans-serif',
                        fill: new ol.style.Fill({
                            color: '#fff'
                        }),
                        backgroundFill: new ol.style.Stroke({
                            color: '#0EC743'
                        }), // 使用与填充相同的背景填充样式
                        padding: [5, 10, 5, 10], // 文本周围的填充,上右下左(像素)
                        cursor: 'pointer'
                    }),
                   //添加图片坐标点
                    image: new ol.style.Icon({
                        src: './point.png',
                        scale: 0.2
                    }),
                   }));
                  let source = new ol.source.Vector();
                  source.addFeature(feature);
                  let layer = new ol.layer.Vector();
                  layer.setSource(source);
                  group.map.addLayer(layer);
                });
页面效果: 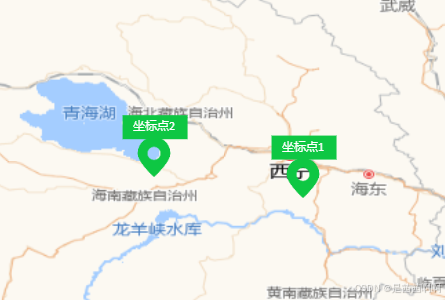
4.清除坐标点及其样式
      group.features=[]
      group.layers=[]


      let source = new ol.source.Vector();
      source.addFeature(feature);
     //用一个数组将feature都放在features数组中
      group.features.push(feature)

      let layer = new ol.layer.Vector();
      layer.setSource(source);
      group.map.addLayer(layer);
     //用一个数组将feature都放在features数组中
      group.layers.push(layer)


        //清除坐标点
        if (group.features.length > 0) {
              group.features.forEach(feature => {
                 feature.setStyle(null)
               })
           }
        if (group.layers.length > 0) {
              group.layers.forEach(layer => {
                group.map.removeLayer(layer);
            })
        }
5.为地图上的坐标点添加点击事件
               // 为地图添加点击事件监听
                group.map.on('click', function (evt) {
                    //点击到地图的经纬度信息
                    const coordinate = evt.coordinate;
                    group.longitude = coordinate[0].toFixed(6)
                    group.latitude = coordinate[1].toFixed(6)

                    //判断是否为添加的坐标点
                    var feature = group.map.forEachFeatureAtPixel(evt.pixel, function
                    (feature) {
                        return feature;
                    });
                    if (feature) {
                       //feature.values_.data为点击的坐标点的基本信息
                       //后续操作。。。。
                    }
                });
6.监听地图上的鼠标滚动事件
 group.map.on('wheel', function (event) {
    // 这里的 `event` 包含了鼠标滚动的详细信息,例如滚动的方向和滚动的像素值
        group.zoom = group.map.getView().getZoom().toFixed(2)
  });
7.监听地图上的坐标点的鼠标滑过事件,并为其添加一个popup框
<div id="popup" class="ol-popup">
<div id="popup-content" class="popup-content">
<div title="关闭弹框" id="popup-closer">
<i class="ivu-icon ivu-icon-md-close"></i>
</div>
<div class="content">
//弹窗里面的内容{{popData}}
</div>
</div>
<div class="arrow"><i class="ivu-icon ivu-icon-md-arrow-dropdown"></i></div>
</div>
// 获取popup的dom对象
var container = document.getElementById('popup');
var closer = document.getElementById('popup-closer');
// 创建popup
var popup = new ol.Overlay({
element: container,
positioning: 'bottom-center',
stopEvent: true,
autoPanAnimation: {
duration: 250
}
});
group.map.addOverlay(popup);
//监听鼠标滑过事件
group.map.on('pointermove', function (e) {
const coordinate = e.coordinate;
//监听鼠标所在经纬度信息
group.mouseLon = coordinate[0].toFixed(6)
group.mouseLat = coordinate[1].toFixed(6)
// 监听鼠标移动事件,移动到feature后弹出popup
var feature = group.map.forEachFeatureAtPixel(e.pixel, function
(feature, layer) {
return feature;
});
if (feature) {
group.popData = feature.values_.data
popup.setPosition(coordinate);
//鼠标经过坐标点变成小手模式
group.map.getTargetElement().style.cursor = 'pointer';
}else{
group.map.getTargetElement().style.cursor = '';
// 关闭popup
closer.onclick = function () {
popup.setPosition(undefined);
closer.blur();
return false;
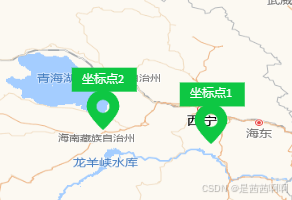
}; 8.点聚合功能,添加多个text文本和样式
// 创建聚合源
var clusterSource = new ol.source.Cluster({
distance: 100, // 点的聚合距离
source: new ol.source.Vector({
//features中添加坐标点的信息
features: group.mapData.map(function (element) {
return new ol.Feature({
title: element.NAME,
data: element,
geometry: new ol.geom.Point([
element.LONGITUDE,
element.LATITUDE,
]),
});
})
})
});
// 创建聚合图层
var clusterLayer = new ol.layer.Vector({
source: clusterSource,
style: function (feature) {
var styles = []
var features = feature.get('features');
console.log('features', features)
var size = feature.get('features').length;
let nameString = features[0].values_.title
//聚合的情况
if (size > 1) {
features.forEach((ele, index) => {
if (index > 0) {
nameString = nameString + '\n' + ele.values_.title
}
})
var style = new ol.style.Style({
image: new ol.style.Circle({
radius: 20,
stroke: new ol.style.Stroke({
color: '#fff'
}),
fill: new ol.style.Fill({
color: 'blue'
})
}),
text: new ol.style.Text({
text: size.toString() > 1 ? size.toString() : '',
fill: new ol.style.Fill({
color: '#fff'
}),
stroke: new ol.style.Stroke({
color: '#000'
})
})
});
var style2 = new ol.style.Style({
text: new ol.style.Text({
text: nameString,
offsetY: -30,
font: '12px Calibri,sans-serif',
fill: new ol.style.Fill({
color: '#fff'
}),
backgroundFill: new ol.style.Stroke({
color: '#0EC743'
}), // 使用与填充相同的背景填充样式
padding: [5, 10, 5, 10], // 文本周围的填充
})
});
//有多个text或者多个样式的话用数组的形式
styles = [style, style2]
return styles;
} else if (size = 1) {
//不聚合的情况
nameString = features[0].values_.title
var style = new ol.style.Style({
text: new ol.style.Text({
text: nameString,
offsetY: -30,
font: '12px Calibri,sans-serif',
fill: new ol.style.Fill({
color: '#fff'
}),
backgroundFill: new ol.style.Stroke({
color: '#0EC743'
}), // 使用与填充相同的背景填充样式
padding: [5, 10, 5, 10], // 文本周围的填充
}),
image: new ol.style.Icon({
src: './point.png',
scale: 0.2
}),
});
styles.push(style);
return styles;
}
}
});
// 将聚合图层添加到地图上
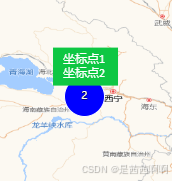
group.map.addLayer(clusterLayer);聚合前:
聚合后:
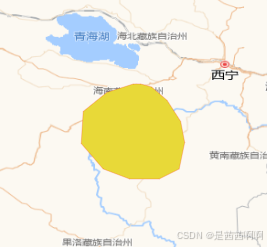
9.画闭合区域
        //画闭合曲线
        // 模拟创建一组闭合曲线的坐标点数组
        const coordinates = [
          [100.67691802343751, 36.3730079046798],
          [100.35831450781251, 36.274017329374914],
          [100.07266997656251, 36.043039320330166],
          [100.05069732031251, 35.658075971922266],
          [100.31436919531251, 35.350105293195945],
          [100.63297271093751, 35.22911681226775],
          [100.98453521093751, 35.22911681226775],
          [101.22623442968751, 35.350105293195945],
          [101.29215239843751, 35.66907492473392],
          [101.24820708593751, 35.92205083940197],
          [101.08341216406251, 36.17502675407002],
          [100.89664458593751, 36.34001104624484],
          [100.76480864843751, 36.3730079046798],
          [100.67691802343751, 36.3730079046798],
        ];

        // 创建线条几何对象
        const lineString = new ol.geom.LineString(coordinates);

        // 创建多边形几何对象
        const polygon = new ol.geom.Polygon([lineString.getCoordinates()]);


        // 创建包含多边形的特征
        const feature = new ol.Feature({
          title: "po1",
          geometry: polygon,
        });

        // 创建特征源
        const vectorSource = new ol.source.Vector({
          features: [feature],
        });


        // 创建矢量层并将其添加到地图上
        const vectorLayer = new ol.layer.Vector({
          source: vectorSource,
          style: new ol.style.Style({
            fill: new ol.style.Fill({
              color: "#e8d938", // 填充颜色,红色
            }),
            stroke: new ol.style.Stroke({
              color: "red", // 边界颜色
              width: 0.2,
            }),
          }),
        });

        group.map.addLayer(vectorLayer);
} 


 2271
2271

 被折叠的 条评论
为什么被折叠?
被折叠的 条评论
为什么被折叠?
 到【灌水乐园】发言


