


 本文介绍了如何利用Python的Matplotlib库进行数据可视化操作,包括绘制图表、设置样式和调整布局等方面,通过示例代码展示了具体步骤和效果。

代码:
import numpy as np
import matplotlib.pyplot as plt

x = np.linspace(0, 2, 100)
y = (np.sin(x - 2) ** 2) * np.exp(-(x ** 2))
plt.plot(x, y)
plt.xlabel('my x label')
plt.ylabel('my y label')
plt.title('$f(x) = sin^2(x-2){e^{-x^2}}$')

plt.savefig('function.pdf')
结果:


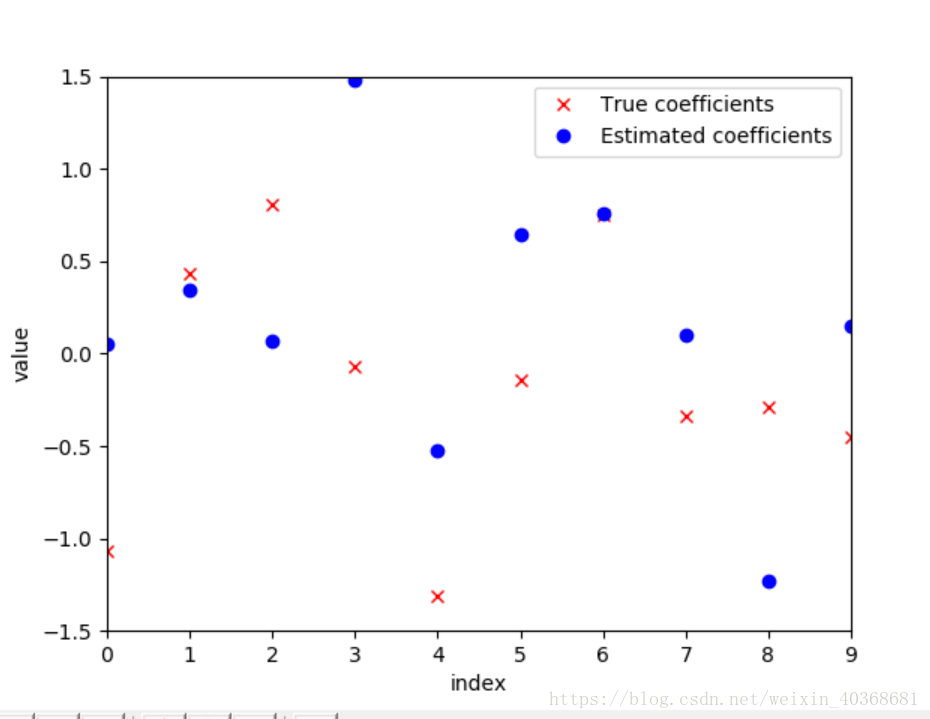
代码:
import numpy as np
import matplotlib.pyplot as plt

X = np.random.random_sample((20, 10)) * 10
b = np.random.random(10) * 3 - 1.5
z = np.random.normal((20,))
y = np.dot(X, b) + z
_b = np.array(np.linalg.lstsq(X, y, rcond = -1)[0])
x = np.arange(0, 10)

f, ax = plt.subplots()
ax.plot(x, b, 'rx', label = 'True coefficients')
ax.plot(x, _b, 'bo', label = 'Estimated coefficients')
ax.set_xlim(0, 9)
ax.set_ylim(-1.5, 1.5)
ax.set_xlabel('index')
ax.set_ylabel('value')
plt.legend()

plt.show()
结果:
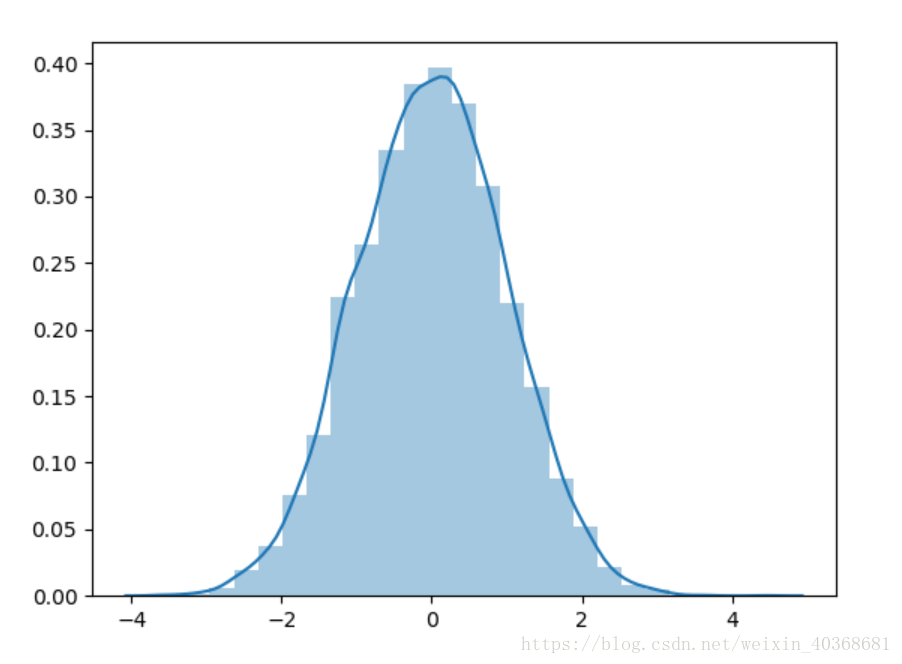
代码:
import numpy as np
import matplotlib.pyplot as plt
import seaborn as sns

data = np.random.normal(size = 10000)
sns.distplot(data, bins = 25, kde = True)
plt.show()
结果:


 418
418

 被折叠的 条评论
为什么被折叠?
被折叠的 条评论
为什么被折叠?
 到【灌水乐园】发言


