


 本文通过一个Python内存泄漏的例子,展示了如何使用tracemalloc库进行内存跟踪。在程序启动时开启内存追踪,然后通过触发多次内存泄露操作,观察内存分配的变化,最终定位到内存泄漏的源头。在多次泄露后,发现内存占用最大的对象是huge_mem,位于代码的第56行。这个案例揭示了在Python中如何诊断和解决内存泄漏问题。
以下面的 huge_mem 为例子,最终可以看到随着每次操作,该对象膨胀到十分巨大
例子及定位方法
# -*- coding: utf-8 -*-
import sys
import tracemalloc
import random
import weakref
from PyQt5.QtWidgets import QWidget, QPushButton, QApplication, QVBoxLayout, QHBoxLayout
class Person(object):
def __init__(self, name=""):
self._name = name
self._best_friend = None
@property
def best_friend(self):
return self._best_friend
@best_friend.setter
def best_friend(self, friend):
self._best_friend = weakref.ref(friend)
class MemoryLeak(QWidget):
def __init__(self):
super().__init__()
self.mem_list = []
# 在程序启动的时候开始跟踪内存分配
tracemalloc.start()
self.zhang_san = Person(name='张三')
self.li_si = Person("李四")
self.initUI()
def initUI(self):
self.vLayout = QVBoxLayout()
self.twoButtonShow()
self.setLayout(self.vLayout)
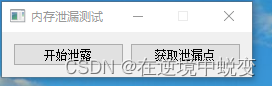
self.setWindowTitle('内存泄漏测试')
self.show()
def twoButtonShow(self):
hLayout = QHBoxLayout()
self.vLayout.addLayout(hLayout)
leakBtn = QPushButton('开始泄露', self)
getLeakPointBtn = QPushButton('获取泄漏点', self)
hLayout.addWidget(leakBtn)
hLayout.addWidget(getLeakPointBtn)
leakBtn.clicked.connect(self.startLeak)
getLeakPointBtn.clicked.connect(self.getLeakPoint)
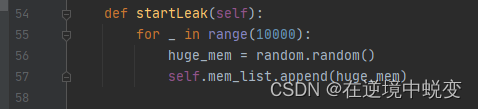
def startLeak(self):
for _ in range(10000):
huge_mem = random.random()
self.mem_list.append(huge_mem)
def getLeakPoint(self):
# 获取Python分配的内存块traceback的快照
snapshot = tracemalloc.take_snapshot()
top_stats = snapshot.statistics('lineno')
# 打印内存占用率最高的前十
print("[ Top 10 ]")
for stat in top_stats[:10]:
print(stat)
if __name__ == '__main__':
app = QApplication(sys.argv)
ex = MemoryLeak()
sys.exit(app.exec_())
在程序刚启动的时候点击一次**“获取内存”**:可以看到如下输出
[ Top 10 ]
F:/PythonXSLWorkSpace/PythonBaseUse/MemoryLeak/bigLeak.py:38: size=15.6 KiB, count=202, average=79 B
F:/PythonXSLWorkSpace/PythonBaseUse/MemoryLeak/bigLeak.py:47: size=13.5 KiB, count=184, average=75 B
F:/PythonXSLWorkSpace/PythonBaseUse/MemoryLeak/bigLeak.py:45: size=1416 B, count=16, average=88 B
F:/PythonXSLWorkSpace/PythonBaseUse/MemoryLeak/bigLeak.py:71: size=1112 B, count=1, average=1112 B
F:/PythonXSLWorkSpace/PythonBaseUse/MemoryLeak/bigLeak.py:39: size=440 B, count=1, average=440 B
F:/PythonXSLWorkSpace/PythonBaseUse/MemoryLeak/bigLeak.py:48: size=216 B, count=2, average=108 B
F:/PythonXSLWorkSpace/PythonBaseUse/MemoryLeak/bigLeak.py:13: size=144 B, count=3, average=48 B
F:/PythonXSLWorkSpace/PythonBaseUse/MemoryLeak/bigLeak.py:72: size=108 B, count=1, average=108 B
F:/PythonXSLWorkSpace/PythonBaseUse/MemoryLeak/bigLeak.py:51: size=72 B, count=1, average=72 B
F:/PythonXSLWorkSpace/PythonBaseUse/MemoryLeak/bigLeak.py:34: size=48 B, count=1, average=48 B
随后我们触发10次 “开始泄露”,重新获取内存可以得到如下:
F:/PythonXSLWorkSpace/PythonBaseUse/MemoryLeak/bigLeak.py:56: size=2344 KiB, count=99996, average=24 B
F:/PythonXSLWorkSpace/PythonBaseUse/MemoryLeak/bigLeak.py:57: size=805 KiB, count=1, average=805 KiB
F:/PythonXSLWorkSpace/PythonBaseUse/MemoryLeak/bigLeak.py:38: size=15.6 KiB, count=202, average=79 B
F:/PythonXSLWorkSpace/PythonBaseUse/MemoryLeak/bigLeak.py:47: size=13.5 KiB, count=184, average=75 B
F:/PythonXSLWorkSpace/PythonBaseUse/MemoryLeak/bigLeak.py:45: size=1416 B, count=16, average=88 B
E:\Python3.8.5\lib\tracemalloc.py:509: size=1248 B, count=3, average=416 B
F:/PythonXSLWorkSpace/PythonBaseUse/MemoryLeak/bigLeak.py:71: size=1112 B, count=1, average=1112 B
E:\Python3.8.5\lib\tracemalloc.py:209: size=896 B, count=3, average=299 B
E:\Python3.8.5\lib\tracemalloc.py:165: size=816 B, count=2, average=408 B
E:\Python3.8.5\lib\tracemalloc.py:65: size=640 B, count=10, average=64 B
触发多次泄露之后可以看到此时占据榜首的是56行也就是 huge_mem 所在行,由此我们可以定义到内存泄露的对象及所在位置
PS.我们要在内存开始泄露前追踪内存分配,也就是调用tracemalloc.start()
tracemalloc文档


 980
980

 被折叠的 条评论
为什么被折叠?
被折叠的 条评论
为什么被折叠?
 到【灌水乐园】发言


