Echart折线图:当多条折线图的name一样时也显示不同的颜色

本文介绍如何在ECharts折线图中,当多条折线拥有相同的name时,为它们设置不同的颜色,通过修改`itemStyle`属性实现。

摘要生成于 C知道 ,由 DeepSeek-R1 满血版支持, 前往体验 >

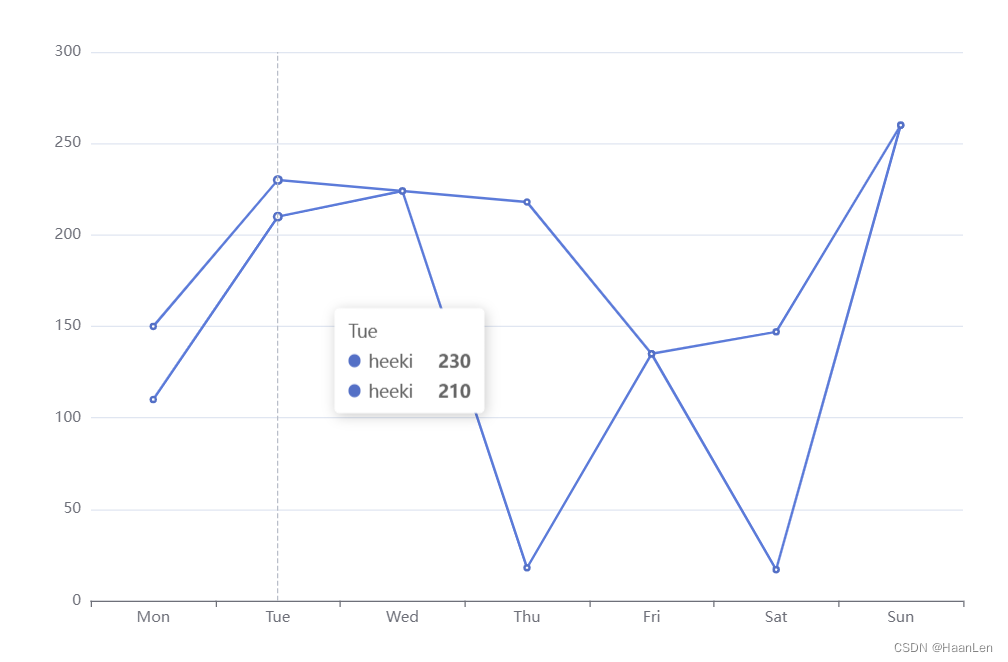
echart折线图,当多条折线图的name一样的,颜色也是一致。

在这里插入图片描述

option = {
  xAxis: {
    type: 'category',
    data: ['Mon', 'Tue', 'Wed', 'Thu', 'Fri', 'Sat', 'Sun']
  },
  tooltip: {
    trigger: 'axis'
  },
  yAxis: {
    type: 'value'
  },
  series: [
    {
      data: [150, 230, 224, 218, 135, 147, 260],
      type: 'line',
      name: 'heeki'
    },
    {
      data: [110, 210, 224, 18, 135, 17, 260],
      type: 'line',
      name: 'heeki'
    }
  ]
};

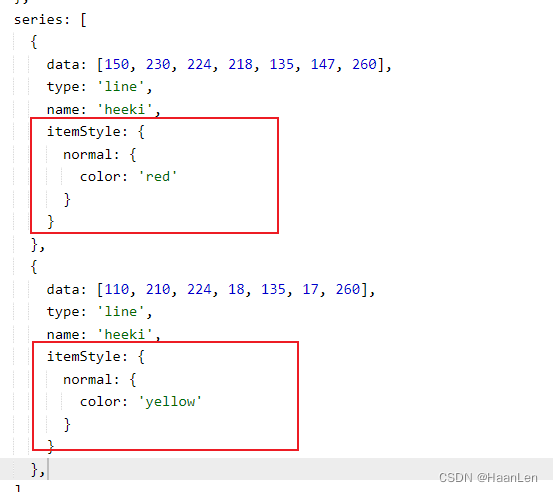
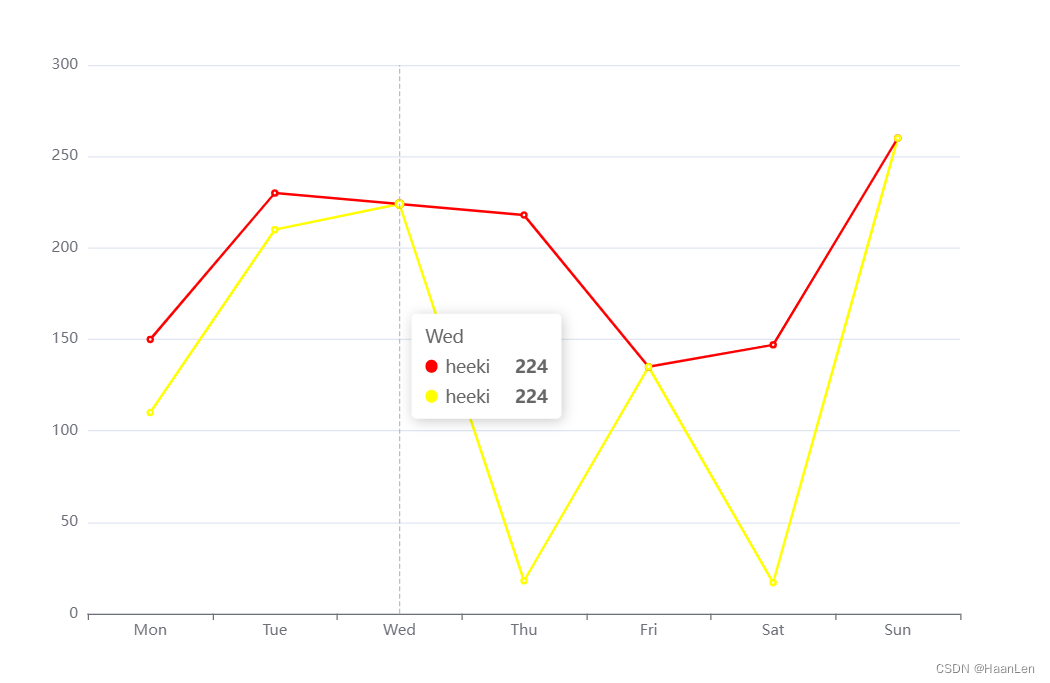
要设置不同颜色,需要在series中单独设置不同的颜色

在这里插入图片描述

在这里插入图片描述

option = {
  xAxis: {
    type: 'category',
    data: ['Mon', 'Tue', 'Wed', 'Thu', 'Fri', 'Sat', 'Sun']
  },
  tooltip: {
    trigger: 'axis'
  },
  yAxis: {
    type: 'value'
  },
  series: [
    {
      data: [150, 230, 224, 218, 135, 147, 260],
      type: 'line',
      name: 'heeki',
      itemStyle: {
        normal: {
          color: 'red'
        }
      }
    },
    {
      data: [110, 210, 224, 18, 135, 17, 260],
      type: 'line',
      name: 'heeki',
      itemStyle: {
        normal: {
          color: 'yellow'
        }
      }
    }
  ]
};

可以使用 ECharts 中的渐变色(Gradient)来实现不同折线区域内展示不同颜色的效果。 以下是一个示例代码: ```html <template> <div class="chart-container"> <div ref="chart" class="chart"></div> </div> </template> <script> import echarts from 'echarts' export default { data() { return { chartData: { legend: { data: ['折线1', '折线2'] }, xAxis: { type: 'category', data: ['周一', '周二', '周三', '周四', '周五', '周六', '周日'] }, yAxis: { type: 'value' }, series: [ { name: '折线1', type: 'line', data: [120, 132, 101, 134, 90, 230, 210], areaStyle: { color: { type: 'linear', x: 0, y: 0, x2: 0, y2: 1, colorStops: [ { offset: 0, color: 'rgba(255, 0, 0, 0.3)' // 0% 处的颜色 }, { offset: 1, color: 'rgba(255, 0, 0, 0)' // 100% 处的颜色 } ], globalCoord: false // 缺省为 false } } }, { name: '折线2', type: 'line', data: [220, 182, 191, 234, 290, 330, 310], areaStyle: { color: { type: 'linear', x: 0, y: 0, x2: 0, y2: 1, colorStops: [ { offset: 0, color: 'rgba(0, 255, 0, 0.3)' // 0% 处的颜色 }, { offset: 1, color: 'rgba(0, 255, 0, 0)' // 100% 处的颜色 } ], globalCoord: false // 缺省为 false } } } ] } } }, mounted() { this.initChart() }, methods: { initChart() { const chart = echarts.init(this.$refs.chart) chart.setOption(this.chartData) } } } </script> <style> .chart-container { width: 100%; height: 400px; } .chart { width: 100%; height: 100%; } </style> ``` 在以上代码中,我们通过设置 `areaStyle` 属性来设置折线区域内的颜色,其中 `color` 属性使用了渐变色。具体的渐变色设置可以参考 ECharts 官方文档。
评论
添加红包

请填写红包祝福语或标题

红包个数最小为10个

红包金额最低5元

当前余额3.43前往充值 >
需支付:10.00
成就一亿技术人!
领取后你会自动成为博主和红包主的粉丝 规则
hope_wisdom
发出的红包
实付
使用余额支付
点击重新获取
扫码支付
钱包余额 0

抵扣说明:

1.余额是钱包充值的虚拟货币,按照1:1的比例进行支付金额的抵扣。
2.余额无法直接购买下载,可以购买VIP、付费专栏及课程。

余额充值