


 本文详细介绍了ELK栈中各组件的安装与配置过程,包括Filebeat收集日志数据发送至Elasticsearch,以及Kibana从Elasticsearch获取数据进行展示的方法。
ELK
备注:主要实现Filebeat向ES报数据,Kibana从ES取数据进行显示
1、FileBeat
1、下载地址
https://www.elastic.co/cn/downloads
2、解压,改名
| tar -xzvf filebeat-6.4.2-linux-x86_64.tar.gz mv filebeat-6.4.2-linux-x86_64 filebeat |
3、修改配置文件
| vim /usr/local/filebeat/filebeat.yml文件:
修改如下配置 filebeat.inputs: - type: log enabled: true paths: - /var/log/a.log filebeat.config.modules: path: ${path.config}/modules.d/*.yml reload.enabled: false setup.template.settings: index.number_of_shards: 1 output.elasticsearch: hosts: ["ES服务的IP地址:9200"] |
4、启动
| 后台方式启动filebeat: nohup /usr/local/filebeat/filebeat -e -c /usr/local/filebeat/filebeat.yml >/dev/null 2>&1 & 将所有标准输出及标准错误输出到/dev/null空设备,即没有任何输出 或者 nohup /usr/local/filebeat/filebeat -e -c /usr/local/filebeat/filebeat.yml > filebeat.log & 停止filebeat: 查找进程ID并kill掉: ps -ef |grep filebeat kill -9 进程号 |
3、ElasticSearch
1、下载地址
https://www.elastic.co/cn/downloads
2、解压,改名
| tar -xzvf elasticsearch-6.4.2.tar.gz mv elasticsearch-6.4.2 elasticsearch |
3、创建用户,修改文件权限(elasticsearch)
| groupadd elasticsearch useradd -g elasticsearch elasticsearch passwd elasticsearch 密码为:elasticsearch |
4、修改配置文件
| vim elasticsearch.yml 添加以下内容: cluster.name: toops node.name: node-1 path.data: /usr/local/elasticsearch/tmp/es/data #注意不要放到共享磁盘,可能会空间不够用 path.logs: /usr/local/elasticsearch/tmp/es/logs #注意不要放到共享磁盘,可能会空间不够用 network.host: 10.61.2.44 http.port: 9200 discovery.zen.ping.unicast.hosts: ["10.61.2.44"] |
注意:启动之前查看以下系统配置,否则启动会报错
| ERROR: [2] bootstrap checks failed [1]: max file descriptors [4096] for elasticsearch process is too low, increase to at least [65536] vi /etc/security/limits.conf 添加如下内容: elasticsearch soft nproc 16384 elasticsearch hard nproc 16384 elasticsearch hard nofile 65536 elasticsearch soft nofile 65536 elasticsearch hard memlock unlimited elasticsearch soft memlock unlimited elasticsearch soft core unlimited elasticsearch hard core unlimited 重新以su elasticsearch配置生效
[2]: max virtual memory areas vm.max_map_count [65530] is too low, increase to at least [262144] vim /etc/sysctl.conf文件最后添加一行 vm.max_map_count=262144 执行以下命令配置实现:/sbin/sysctl -p 查看:sysctl -a|grep vm.max_map_count |
5、启动
| su elasticsearch /usr/local/elasticsearch/bin/elasticsearch & 查看进程 ps -ef|grep elasticsearch可以看见进程以及启动了 |
6、elasticsearch常用操作
| 查看健康度: curl -X GET -i 'http://10.61.2.44:9200/_cluster/health?pretty' 查看所有节点索引: curl -X GET -i 'http://10.61.2.44:9200/_cat/indices?v' 删除某个索引: curl -X DELETE –i 'http://10.61.2.44:9200/index名' #支持通配 从索引查询数据: curl -X GET -i 'http://10.61.2.44:9200/ index名/_search' |
7、测试
| 1、先检查9200端口是否起来 netstat -antp |grep 9200 2、浏览器访问测试是否正常(以下为正常) # curl http://127.0.0.1:9200/ { "name" : "linux-node1", "cluster_name" : "demon", "cluster_uuid" : "kM0GMFrsQ8K_cl5Fn7BF-g", "version" : { "number" : "5.4.0", "build_hash" : "780f8c4", "build_date" : "2017-04-28T17:43:27.229Z", "build_snapshot" : false, "lucene_version" : "6.5.0" }, "tagline" : "You Know, for Search" } |
8、elasticsearch-head 插件
| 挖坑待填!!! |
9、常见错误
| SearchPhaseExecutionException: all shards failed 查看是哪个index错误了,直接删除错误的index。 |
4、kibana
1、下载地址
2、解压改名
| tar -xzvf kibana-6.4.2-linux-x86_64.tar.gz mv kibana-6.4.2-linux-x86_64 kibana |
3、修改配置文件
| vim server.port: 5601 server.host: "10.61.2.44" elasticsearch.url: "http://10.61.2.44:9200" |
4、启动
| nohup /usr/local/kibana/bin/kibana & |
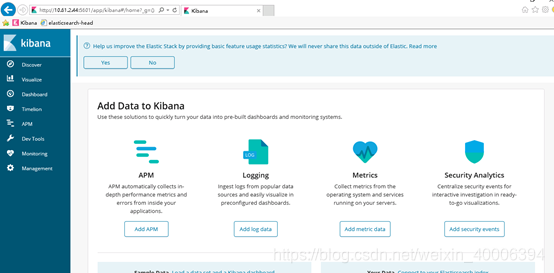
5、验证
|
|


 3440
3440

 被折叠的 条评论
为什么被折叠?
被折叠的 条评论
为什么被折叠?
 到【灌水乐园】发言


