


 AntV F2是蚂蚁金服推出的专注于移动设备的可视化解决方案,它支持H5环境并兼容多种平台,包括Node、小程序和Weex。F2提供了完备的图形语法理论,满足各种可视化需求,尤其在移动端图表体验方面表现卓越。本文详细介绍了如何使用F2创建柱状图和饼状图,并展示了具体的代码实现。
AntV 是蚂蚁金服全新一代数据可视化解决方案,致力于提供一套简单方便、专业可靠、无限可能的数据可视化最佳实践。
F2 是一个专注于移动,开箱即用的可视化解决方案,完美支持 H5 环境同时兼容多种环境(Node, 小程序,Weex),完备的图形语法理论,满足你的各种可视化需求,专业的移动设计指引为你带来最佳的移动端图表体验。
一、黑屏终端
npm install @antv/f2 --save
二、main.js中全局引入
	import F2 from '@antv/f2'
	Vue.prototype.$F2= F2;
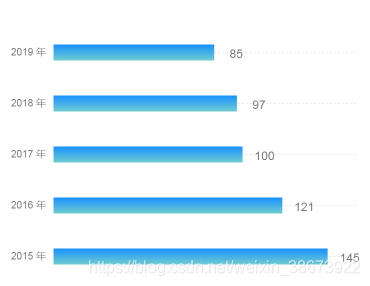
三、柱状图
<canvas id="boxCanvas" style="width: 100%;height: 300px;"></canvas>
		data() {
			return {
				data: [{
			        year: '2015 年',
			        sales: 145
			      }, {
			        year: '2016 年',
			        sales: 121
			      }, {
			        year: '2017 年',
			        sales: 100
			      }, {
			        year: '2018 年',
			        sales: 97
			      }, {
			        year: '2019 年',
			        sales: 85
			      }
				]
			}
		}
		methods: {
			barChart() {
				// Step 1: 创建 Chart 对象
				const chart = new this.$F2.Chart({
					id: 'boxCanvas',
					pixelRatio: window.devicePixelRatio 	// 指定分辨率
				});

				// Step 2: 载入数据源
				chart.source(this.data, {
				  sales: {
				    tickCount: 5
				  }
				});
				//Step 3 :是否横着显示
				chart.coord({
				  transposed: true
				});
				//Step 4 :隐藏x轴
				chart.axis('sales', false);
				//Step 5 :点击柱状图提示信息
				chart.tooltip({
				  showItemMarker: false,
				  onShow: function onShow(ev) {
				    const items = ev.items;
				    items[0].name = null;
				    items[0].name = items[0].title;
				    items[0].value = '¥ ' + items[0].value;
				  }
				});
				//Step 6 :显示信息值
				this.data.forEach(function(obj) {
				  chart.guide().text({
				    position: [ obj.year, obj.sales ],
				    content: obj.sales,
				    style: {
				      textBaseline: 'bottom',
				      textAlign: 'center'
				    },
				    offsetY:8,
				    offsetX:22
				  });
				});
				//Step 7: 让柱状图的宽度适配不同的屏幕尺寸
				//var barWidth = 36 * (window.innerWidth / 375);
				var barWidth = 16 * (window.innerWidth / 375);
				// Step 8:定义柱状图渐变色
      			chart.interval().position('year*sales').color('l(90) 0:#1890ff 1:#70cdd0').size(barWidth);
				// Step 9: 渲染图表
				chart.render();
			},
		}
		mounted() {
			var v = this;
			this.$nextTick(() => {
				v.barChart();
			});
		},
四、效果图
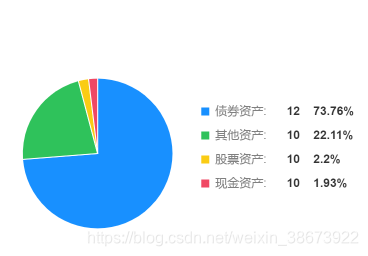
五、饼状图
<canvas id="piechart" style="width: 100%;height: 300px;"></canvas>
		data() {
			return {
				data2:[{
				  assetType: '债券资产',
				  percent: 73.76,
				  num:12,
				  const: 'const'
				}, {
				  assetType: '其他资产',
				  percent: 22.11,
				  num:10,
				  const: 'const'
				}, {
				  assetType: '股票资产',
				  percent: 2.20,
				  num:10,
				  const: 'const'
				}, {
				  assetType: '现金资产',
				  percent: 1.93,
				  num:10,
				  const: 'const'
				}],
			}
		}
		methods: {
			pieChart(){
				const colorMap = {
				  债券资产: '#1890FF',
				  其他资产: '#2FC25B',
				  股票资产: '#FACC14',
				  现金资产: '#F04864'
				};
				// 设置图例项的内容
				const legendItems = [];
				this.data2.forEach(function(obj) {
				  const item = {
				    name: obj.assetType,
				    value: '     ' + obj.num + '    ' + obj.percent + '%',
				    marker: {
				      symbol: 'square',
				      fill: colorMap[obj.assetType],
				      radius: 4
				    }
				  };
				  legendItems.push(item);
				});

				const piechart = new this.$F2.Chart({
				  id: 'piechart',
				  pixelRatio: window.devicePixelRatio
				});
				piechart.source(this.data2, {
				  percent: {
				    formatter: function formatter(val) {
				      return val + '%';
				    }
				  }
				});
				piechart.coord('polar', {
				  transposed: true,
				  radius: 0.85
				});
				piechart.legend({
				  position: 'right',
				  custom: true,
				  items: legendItems,
				  nameStyle: {
				    fill: '#808080'
				  }, // 图例项 key 值文本样式
				  valueStyle: {
				    fill: '#333',
				    fontWeight: 'bold' // 图例项 value 值文本样式
				  }
				});
				piechart.axis(false);
				piechart.interval()
				  .position('const*percent')
				  .color('assetType', function(val) {
				    return colorMap[val];
				  })
				  .adjust('stack')
				  .style({
				    lineWidth: 1,
				    stroke: '#fff'
				  });
				piechart.render();
			},
		}
		mounted() {
			var v = this;
			this.$nextTick(() => {
				v.pieChart();
			});
		},
六、效果图


 1719
1719

 被折叠的 条评论
为什么被折叠?
被折叠的 条评论
为什么被折叠?
 到【灌水乐园】发言


