


 本文介绍了如何在Vue项目中结合Vux组件库和AntV的F2图表库,创建一个移动端图表应用,特别是实现了渐变色的图表效果。
最终效果: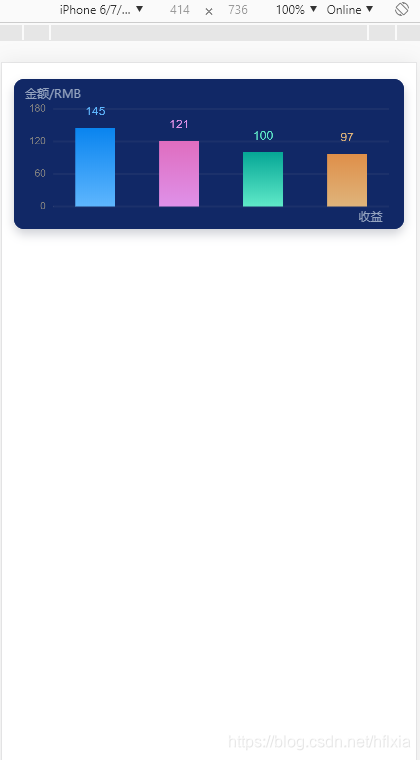
1.安装:
npm install @antv/f2 --save
<template>
	<div class="box">
		<div class="chart">
			<span class="y-title">金额/RMB</span>
			<canvas id="mountNode">
			</canvas>
			<span class="x-title">收益</span>
		</div>
	</div>

</template>

<script>
	import F2 from "@antv/f2" //引入插件
	export default {
		components: {
		},
	    data() {
	        return{

	        }
	    },
	    mounted () {
	        this.showChart();
	    },
	    methods: {
			// 图表数据初始化
			showChart(){
				// 数据源
				var data = [{
						year: '2014 年',
						sales: 145,
						color:'#5eb6fe'
					}, {
						year: '2015 年',
						sales: 121,
						color:'#df91e9'
					}, {
						year: '2016 年',
						sales: 100,
						color:'#5fe9c8'
					}, {
						year: '2017 年',
						sales: 97,
						color:'#dfb47b'
					},
				];

				 // Step 1: 创建 Chart 对象
				var chart = new F2.Chart({
					id: 'mountNode',
					pixelRatio: window.devicePixelRatio
				});

				// Step 2: 载入数据源
				chart.source(data, {
					sales: {
					tickCount: 4
					}
				});

				// 隐藏单元标注
				chart.legend(false);
				chart.axis('year', {
					line: null
				});

				// 隐藏点击提示标注
				chart.tooltip(false);

				  // 显示 X 轴坐标轴文本为空
				chart.axis('year', {
					label: function label(text) {
					  return {
						text:'',
						fillStyle:'#fff'
					  };
					}
				});

				// y坐标字体颜色设置
				chart.axis('sales', {
					label: function label(text) {
					  return {
						fillStyle:'#fff'
					  };
					}
				});

				// 图内y虚线设置
				chart.axis('sales', {
					grid:{
						lineDash: null,//实线
						strokeStyle  :'#1c316b',
						lineWidth: 2
					},

				});

				// 图标提示信息设置
				data.map(function(obj) {
					chart.guide().text({
					  position: [obj.year, obj.sales],
					  content: obj.sales,//顶部提示
					  style: {
						textAlign: 'center',
						textBaseline: 'bottom',
						fill:obj.color//顶部字体颜色
					  },
					  offsetY: -10
					});
				});

				// 让柱状图的宽度适配不同的屏幕尺寸
				var barWidth = 36 * (window.innerWidth / 375);
				// Step 3:创建图形语法,绘制柱状图,由 genre 和 sold 两个属性决定图形位置,genre 映射至 x 轴,sold 映射至 y 轴  渐变色设置
				chart.interval().position('year*sales').color('year',['l(90) 0:#0984ef 1:#5eb6fe','l(90) 0:#df6dbf 1:#df91e9','l(90) 0:#06a796 1:#5fe9c8','l(90) 0:#df8f49 1:#dfb47b']) // 定义柱状图渐变色
				.size(barWidth);
				// Step 4: 渲染图表
				chart.render();
			}
		}
	}
</script>

<style lang="scss">
	.box{
		position:fixed;
		top:0;
		left:0;
		bottom:0;
		right:0;
	}
	.chart{
		width:94%;
		height:4rem;
		position:relative;
		margin:.43rem auto;
		background:#112866;
		border-radius:.27rem;
		box-shadow:0px .133rem .27rem 0px rgba(133,137,151,0.4);
		span{
			color:#95a4bf;
			font-size:.27rem;
			position:absolute;
			height:.27rem;
		}
		.y-title{
			top:.15rem;
			left:.28rem;
			width:1.5rem;
		}
		.x-title{
			width:1rem;
			bottom:.3rem;
			right:.2rem;
		}
		#mountNode{
			width:100%;
			height:4rem;
			border-radius:.27rem;
			background:#112866;
		}
	}
</style>


 4094
4094

 被折叠的 条评论
为什么被折叠?
被折叠的 条评论
为什么被折叠?
 到【灌水乐园】发言


