


接上一篇:https://blog.youkuaiyun.com/weixin_38498942/article/details/146475939
启用中断请求 (IRQ) 跟踪
要启用中断跟踪,请运行以下命令:
mount -t debugfs none /sys/kernel/debug
echo 1 > /sys/kernel/debug/tracing/events/irq/irq_handler_entry/enable
cat /sys/kernel/debug/tracing/trace
cat /sys/kernel/debug/tracing/trace_pipe
输出示例:
TASK-PID CPU# TIMESTAMP FUNCTION
| | | | |
adbd-302 [000] 295.075568: irq_handler_entry: irq=132 name=msm_otg
adbd-302 [000] 295.075599: irq_handler_entry: irq=132 name=msm_hsusb
adbd-302 [000] 295.075782: irq_handler_entry: irq=132 name=msm_otg
adbd-302 [000] 295.075782: irq_handler_entry: irq=132 name=msm_hsusb
<idle>-0 [000] 295.076270: irq_handler_entry: irq=132 name=msm_otg
<idle>-0 [000] 295.076270: irq_handler_entry: irq=132 name=msm_hsusb
<idle>-0 [000] 295.077155: irq_handler_entry: irq=18 name=gp_timer
<idle>-0 [000] 295.087166: irq_handler_entry: irq=18 name=gp_timer
<idle>-0 [000] 295.097146: irq_handler_entry: irq=18 name=gp_timer
启用计划程序跟踪
要跟踪任务之间的上下文切换,请运行以下命令以 启用跟踪器:sched_switch
mount -t debugfs none /sys/kernel/debug
echo 1 > /sys/kernel/debug/tracing/events/sched/sched_switch/enable
cat /sys/kernel/debug/tracing/trace
cat /sys/kernel/debug/tracing/trace_pipe
输出示例:
TASK-PID CPU# TIMESTAMP FUNCTION
| | | | |
WindowManagerPo-484 [000] 994.583135: sched_switch: prev_comm=WindowManagerPo
SurfaceFlinger-334 [000] 994.583652: sched_switch: prev_comm=SurfaceFlinger
WindowManagerPo-484 [000] 994.584320: sched_switch: prev_comm=WindowManagerPo
GL updater-675 [000] 994.584370: sched_switch: prev_comm=GL updater
WindowManagerPo-484 [000] 994.584424: sched_switch: prev_comm=WindowManagerPo
查找 IRQ 延迟
要查找系统中的最大 IRQ 延迟和抢占延迟,请为 和 启用 ftrace 配置,如下所示:IRQOFF``PREEMPTIONOFF
CONFIG_IRQSOFF_TRACER =Y
CONFIG_PREEMPT_TRACER =Y
要使此配置生效,请重新编译内核。此配置可有效地检测延迟(以毫秒为单位)。
要启用跟踪,请运行以下命令:
echo 0 > /sys/kernel/debug/tracing/tracing_enabled
echo 0 > /sys/kernel/debug/tracing/tracing_max_latency
echo irqsoff > /sys/kernel/debug/tracing/current_tracer
echo 1 > /sys/kernel/debug/tracing/tracing_enabled
cat /sys/kernel/debug/tracing/trace
要查找系统中观察到的最大延迟,请配置 .要检测任何高于指定限制的延迟,请设置阈值级别(以微秒为单位)。例如tracing_max_latency = 0
echo 2000 > /sys/kernel/debug/tracing/tracing_thresh
以下示例显示了 IRQ 延迟为 16 毫秒的跟踪:
cat /sys/kernel/debug/tracing/trace

# tracer: irqsoff
#
# WARNING: FUNCTION TRACING IS CORRUPTED
# MAY BE MISSING FUNCTION EVENTS
# irqsoff latency trace v1.1.5 on 3.4.0-perf-g7736d93-dirty
# --------------------------------------------------------------------
# latency: 16757 us, #4/4, CPU#0 | (M:preempt VP:0, KP:0, SP:0 HP:0 #P:1)
# -----------------
# | task: EventThread-534 (uid:1000 nice:-9 policy:0 rt_prio:0)
# -----------------
# => started at: _raw_spin_lock_irqsave
# => ended at: _raw_spin_unlock_irqrestore
#
#
# _------=> CPU#
# / _-----=> irqs-off
# | / _----=> need-resched
# || / _---=> hardirq/softirq
# ||| / _--=> preempt-depth
# |||| / delay
# cmd pid ||||| time | caller
# / ||||| | /
<...>-534 0d... 0us!: _raw_spin_lock_irqsave
<...>-534 0d..1 16756us+: _raw_spin_unlock_irqrestore
<...>-534 0d..1 16758us+: trace_hardirqs_on <-_raw_spin_unlock_irqrestore
<...>-534 0d..1 16780us : <stack trace>

=> trace_hardirqs_on
=> _raw_spin_unlock_irqrestore
=> clk_enable
=> mdss_dsi_clk_enable
=> mdss_dsi_clk_ctrl
=> mdss_dsi_clk_req
=> mdss_dsi_event_handler
=> mdss_mdp_ctl_intf_event
=> mdss_mdp_cmd_add_vsync_handler
=> mdss_mdp_overlay_vsync_ctrl
=> mdss_mdp_overlay_ioctl_handler
=> mdss_fb_ioctl
=> do_fb_ioctl
=> fb_ioctl
=> do_vfs_ioctl
=> sys_ioctl
=> ret_fast_syscall
/sys/kernel/debug/tracing #
有关更多信息,请参阅在 https://www.kernel.org/doc/Documentation 上提供。Documentation/trace/ftrace.txt
收集和解析 RAM 转储
RAM 转储是设备发生故障时系统内存的快照,可用于调试各种崩溃问题。
启用 RAM 转储
默认情况下,RAM 转储在构建中处于启用状态,但在 /non-DEBUG 构建中使用内核命令行参数将其禁用。要配置 RAM 转储,请使用文件中的参数:debug``perf``qcom_scm.download_mode``meta-qcom-hwe/conf/machine/include/<qcom-qcs6490.inc>
-
0 – 禁用
-
1 – 启用
下表列出了不同芯片组对应的文件:.inc
| 芯片组 | 文件名 |
|---|---|
| QCS5430/QCS6490 | meta-qcom-hwe/conf/machine/include/qcom-qcs6490.inc |
| QCS8275 | meta-qcom-hwe/conf/machine/include/qcom-qcs8300.inc |
| QCS9075 | meta-qcom-hwe/conf/machine/include/qcom-qcs9100.inc |
收集 RAM 转储
要通过 USB 收集 RAM 转储,请使用 Product Configuration Assistant Tool (PCAT)。从 高通 软件中心下载 PCAT 工具。安装 PCAT 后,请在以下位置访问 PCAT 用户指南:
-
Windows 主机:
C:\Program Files(x86)\Qualcomm\PCAT\Docs -
Linux 主机:
/opt/qcom/PCAT/Docs/
要使用 PCAT 收集 RAM 转储,请执行以下作:
-
在 Windows 主机上启动 PCAT 并连接已处于 RAM 转储模式的设备。
如有必要,要触发设备崩溃,请单击 PCAT 界面上的 CRASH。
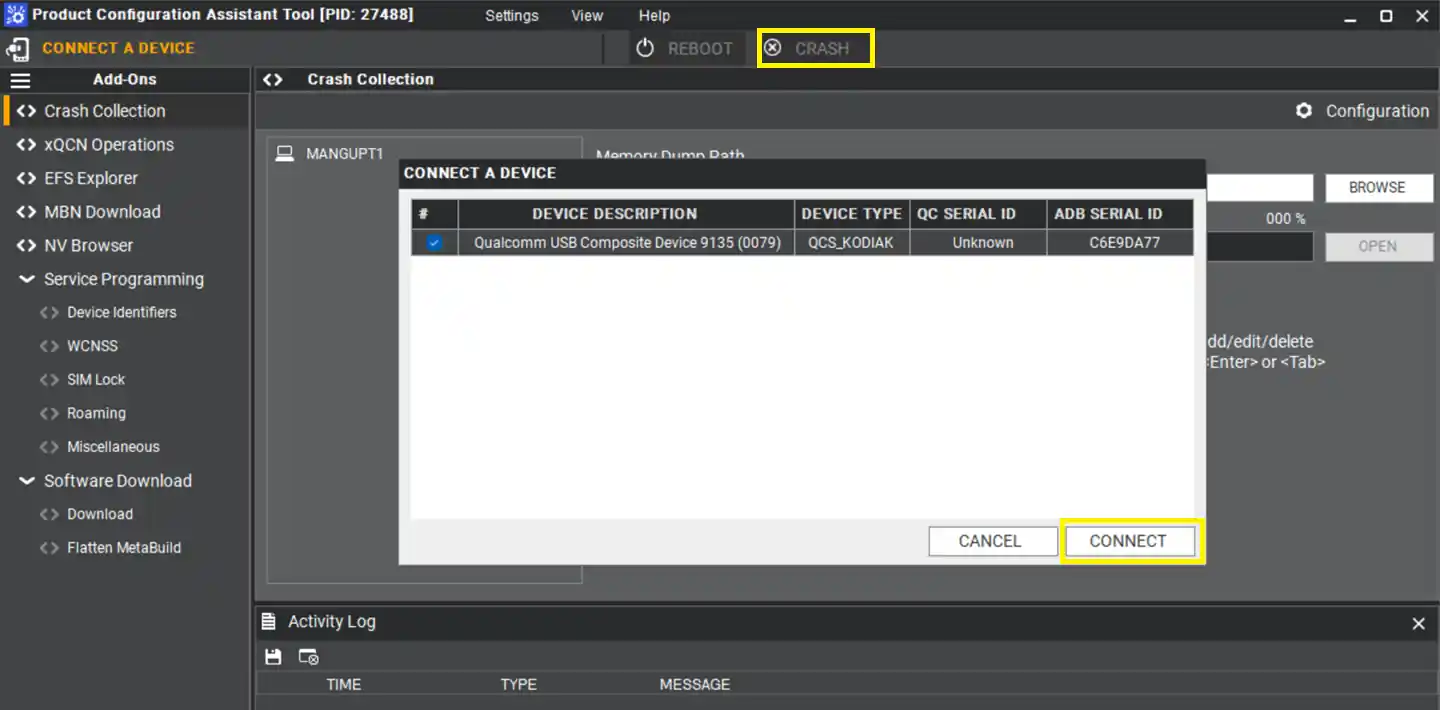
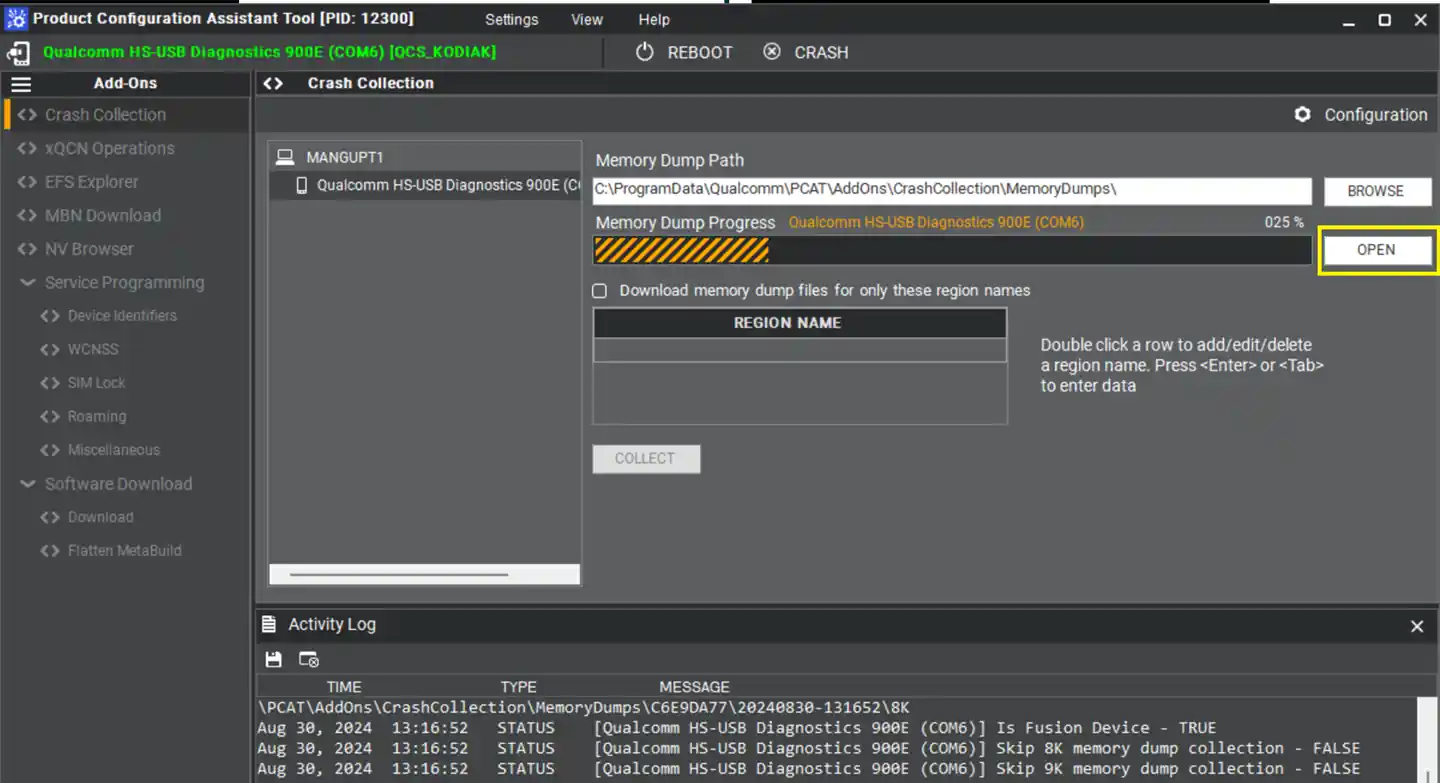
设备连接到 Windows 主机后,PCAT 会自动开始捕获 RAM 转储,并且转储收集进度会显示在 PCAT UI 上。
-
要查看转储,请单击 OPEN。
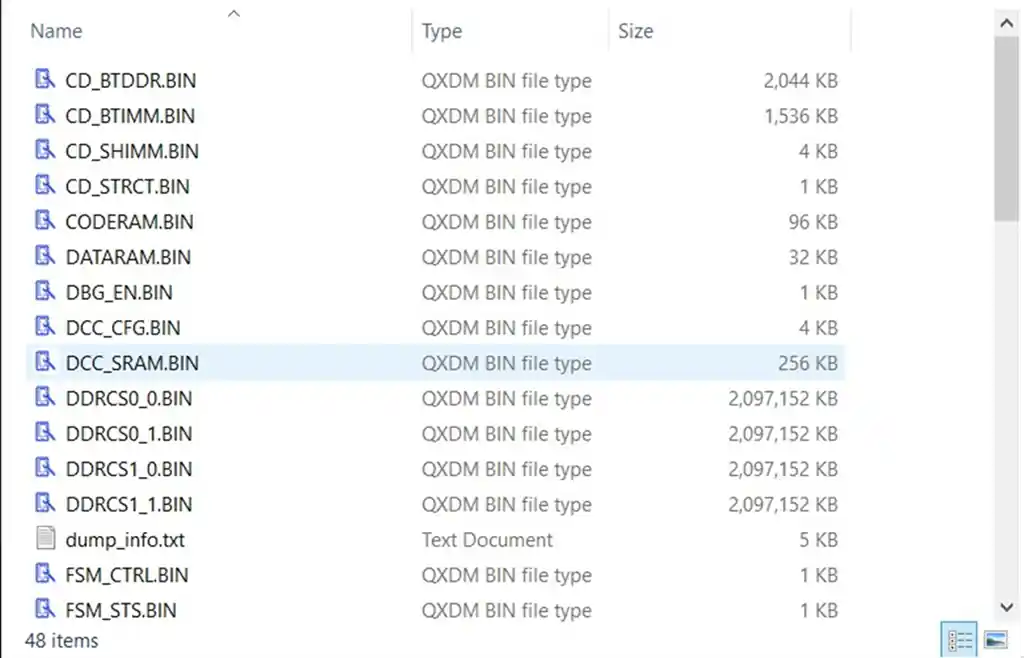
以下是显示 RAM 转储目录内容的示例:
注意
Linux 主机使用命令行界面,而不是 GUI 进行基于 PCAT 的 RAM 转储捕获,例如 .PCAT -PLUGIN CC -DEVICE <serial-id> -DUMPDIR /tmp -RESET TRUE -UNIQUETS TRUE
使用 RAMParser 解析 RAM 转储
Linux RAM 转储解析器 (RAMParser) 是一种开源工具,用于解析 高通Linux 设备上的 RAM 转储。RAMParser 使用 Linux 内核符号文件(包括 vmlinux 和内核对象模块)处理 RAM 转储,并提取有用的信息,例如进程堆栈、IRQ 和工作队列。
注意:RAMParser 工具仅为 Windows 构建和验证。
先决条件
-
RAM dump 和相应的文件
vmlinux -
软件映像和脚本
-
Windows 电脑
-
Python 3.7 或更高版本
python -m pip install --trusted-host files.pythonhosted.org --trusted-host pypi.org --trusted-host pypi.python.org prettytablepython -m pip install --trusted-host files.pythonhosted.org --trusted-host pypi.org --trusted-host pypi.python.org pyelftools
-
-
pyelftools 软件包
-
从 https://github.com/eliben/pyelftools 下载 Pyelftools 包。
-
解压缩下载的文件并查找目录。
pyelftools-master>elftools -
将 elftools 目录复制到 < 安装的 Python 中。
path>\Lib\site-packages
-
-
RAMParser 软件
从 https://git.codelinaro.org/clo/la/platform/vendor/qcom-opensource/tools/-/tree/opensource-tools.lnx.1.0 下载 RAMParser 软件。
注意
RAMParser 软件必须始终存在于 Windows 主机上的 C 盘中。
-
(可选)TRACE32 C 盘 (
C:\T32)TRACE32 用于使用 RAMParser 输出文件在 TRACE32 模拟器中加载 RAM 转储。
设置工具链
RAMParser 需要访问 gdb 和 nm 工具。您可以通过以下方式之一指定 gdb 和 nm 工具的路径:
-
使用 和 指定绝对路径
--gdb-path``--nm-path -
用于指定前缀
CROSS_COMPILE -
使用 file
local_settings.py
注意
不支持仅在路径上提供 gdb 或 nm,因为要调用的名称有太多变体。
要使用该文件设置工具链,请执行以下作:local_settings.py
-
创建一个在根目录中命名的目录。
ramparser_utils\utils -
从 https://developer.arm.com/downloads/-/arm-gnu-toolchain-downloads 下载目录中的工具链。
ramparser_utils\utils
local_settings.py
RAMParser 尝试自动确定大多数设置。但是,有一些设置是运行时环境独有的。这些唯一设置在文件中指定。由于 是 Python 文件,因此它可以利用 Python 功能。local_settings.py``local_settings.py
注意
为了让 RAMParser 为工具链实用程序选择正确的路径,请将文件添加到 path 目录。local_settings.py``<root>/tools/linux-ramdump-parser-v2
文件的格式为:local_settings.py
<setting name> = <string identifying the feature>
该文件支持以下功能:local_settings.py
表 : local_settings.py 文件中支持的功能
| 特征 | 描述 |
|---|---|
| gdb_path | 用于 RAM 转储的 gdb 工具的绝对路径 |
| nm_path | 用于 RAM 转储的 nm 工具的绝对路径 |
| gdb64_path | 用于 RAM 转储的 64 位 gdb 工具的绝对路径 |
| nm64_path | 用于 RAM 转储的 64 位 nm 工具的绝对路径 |
| objdump_path | 用于 RAM 转储的对象转储工具的绝对路径 |
| objdump64_path | 用于 RAM 转储的 64 位对象转储工具的绝对路径 |
示例:local_settings.py
import parser_util,os,sys
path = os.path.abspath(os.path.dirname(__file__))
ramparser_utils_path = os.path.abspath(os.path.join(path, "../../ramparser_utils"))
nm_path =  ramparser_utils_path + "\\utils\\arm-none-eabi-nm.exe"
gdb_path = ramparser_utils_path + "\\utils\\arm-none-eabi-gdb.exe"
objdump_path =  ramparser_utils_path + "\\utils\\objdump.exe"
nm64_path = ramparser_utils_path + "\\utils\\aarch64-linux-gnu-nm.exe"
gdb64_path = ramparser_utils_path + "\\utils\\mingw64\\bin\\gdb-multiarch.exe"
objdump64_path = ramparser_utils_path + "\\utils\\all-objdump.exe"
RAMParser 命令
要使用 RAMParser 解析转储,请在 Windows Shell 中运行以下命令:
python ramparse.py --vmlinux <vmlinux path> --auto-dump <dump path> --force-hardware <hw name> <parser options> --mod_path <symbol path> -o <output path>
-
<hw name>:此字符串指定芯片组的硬件 ID。请参阅下表并使用适当的值。芯片组 硬件名称 QCS6490 qcm6490QCS5430 qcm6490QCS8275 qcs8300QCS9075 qcs9100 -
python ramparse.py:此文件调用 RAMParser。 -
mod_path:指定此选项可将所有未剥离的内核模块复制到一个目录中,并将其引用为该选项的符号路径。--mod_path -
<parser options>:指定解析器选项以从 RAM 转储中提取特定数据。此外,您还可以在命令中传递 subparser 选项以提取相关数据。例如,要提取 Ftrace 信息,请传递相关参数并运行命令:--dump-ftracepython <root>\tools\linux-ramdump-parser-v2\ramparse.py --vmlinux <vmlinux path> --auto-dump <dump path> --force-hardware <hw name> --dump-ftrace --ftrace-args=rwmmio --ftrace_buffer_size_kb 4096 --mod_path <symbol path> -o <output path>同样,要提取 kconfig 信息,请将 .有多个选项可用于解析转储并将输出存储在目录中。
--print-kconfig要查看所有可用的命令和选项,请运行以下命令:
python ramparse.py --help
RAMParser 日志
RAMParser 生成有关工作队列、进程状态和调用堆栈的大量数据。下表列出了在 RAMParser 执行过程中生成的重要文件。
表:RAMParser 生成的文件
| 文件名 | 描述 |
|---|---|
dmesg_TZ.txt | 此文件包含内核日志、运行队列、工作队列和 IRQ 统计信息。 |
mem_stat.txt | 此文件提供有关系统内存的统计信息。 |
memory.txt | 此文件提供有关系统内存的统计信息。 |
tasks.txt | 此文件为所有进程提供内核空间调用堆栈。 |
devicetree.dtb | 此文件是内核使用的设备树 blob。 |
launch_t32.bat | 此文件启动 TRACE32 模拟器启动器文件以加载 RAM 转储。 |
timerlist.txt | 此文件提供活动计时器的列表。 |
以下屏幕截图显示了 RAMParser 生成的示例数据:
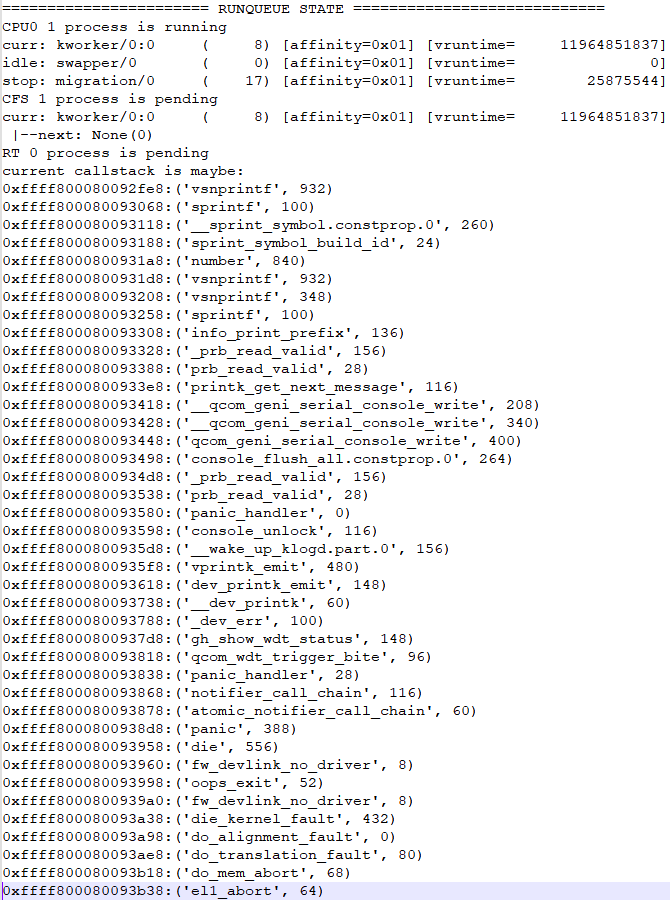
图:Runqueue (dmesg_TZ.txt)
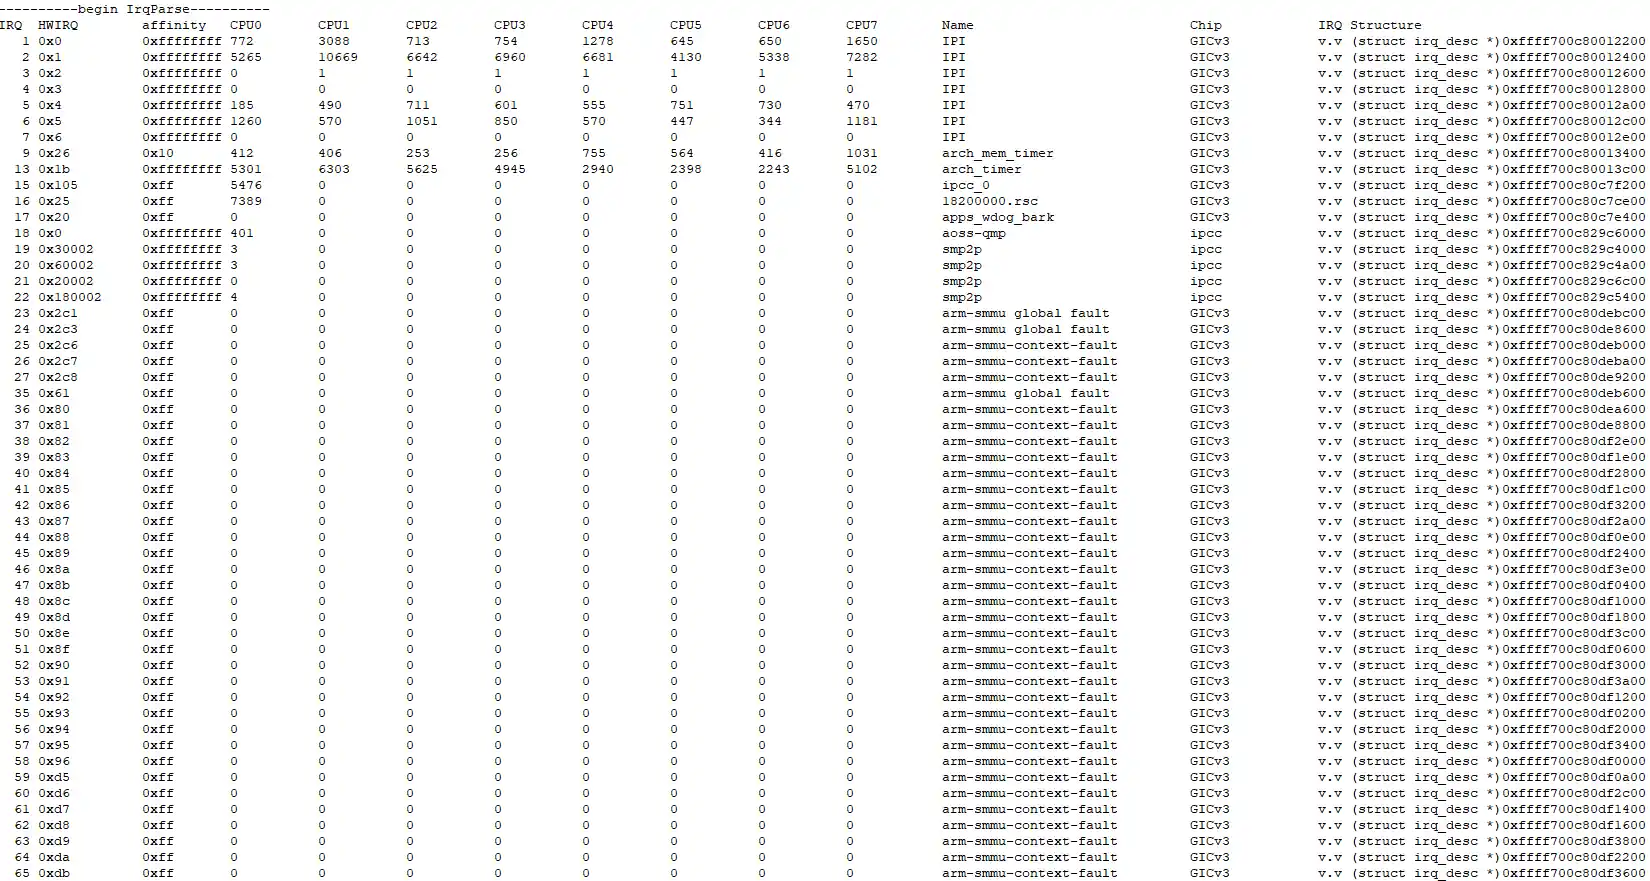
图:IRQ state (dmesg_TZ.txt)
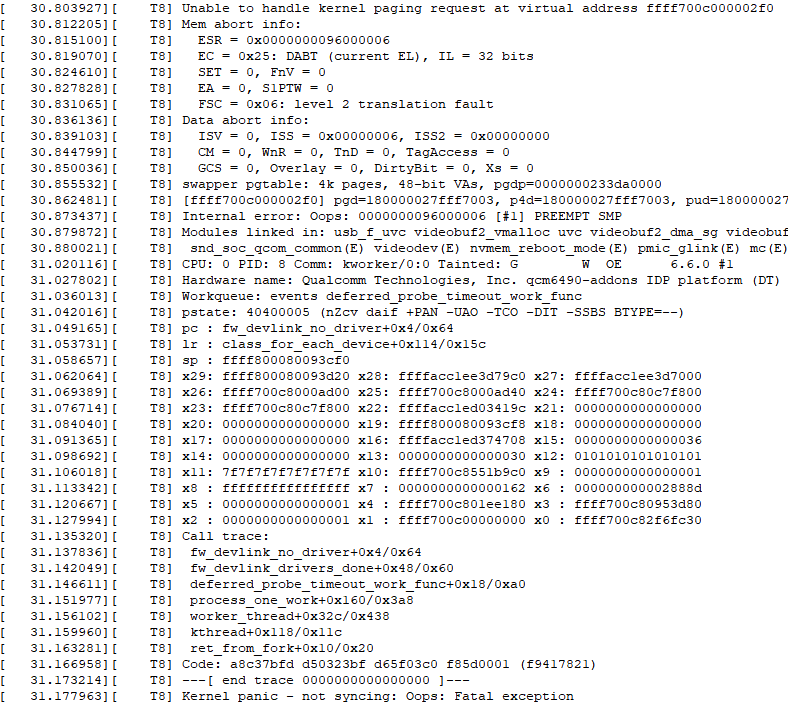
图:Sample kernel crash (dmesg_TZ.txt)
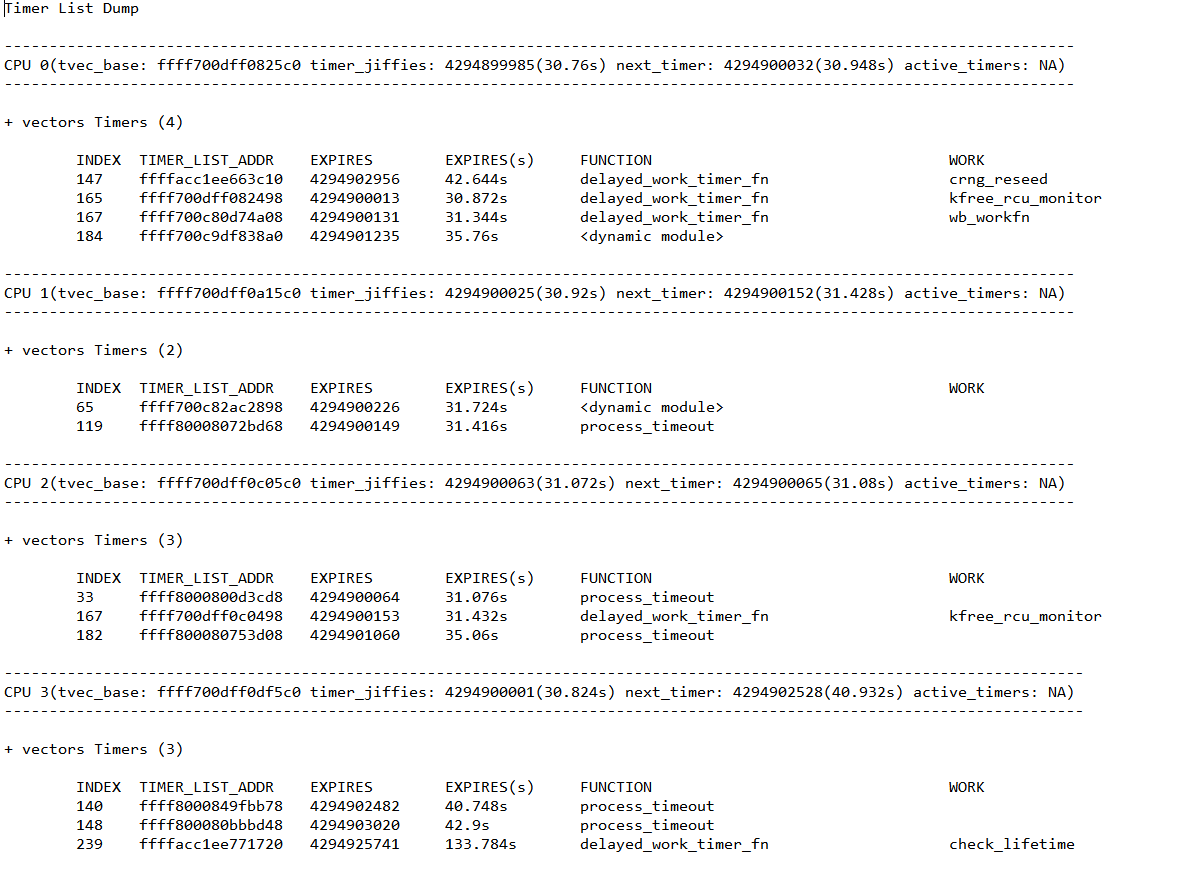
图:Timer list of cores (timerlist.txt)
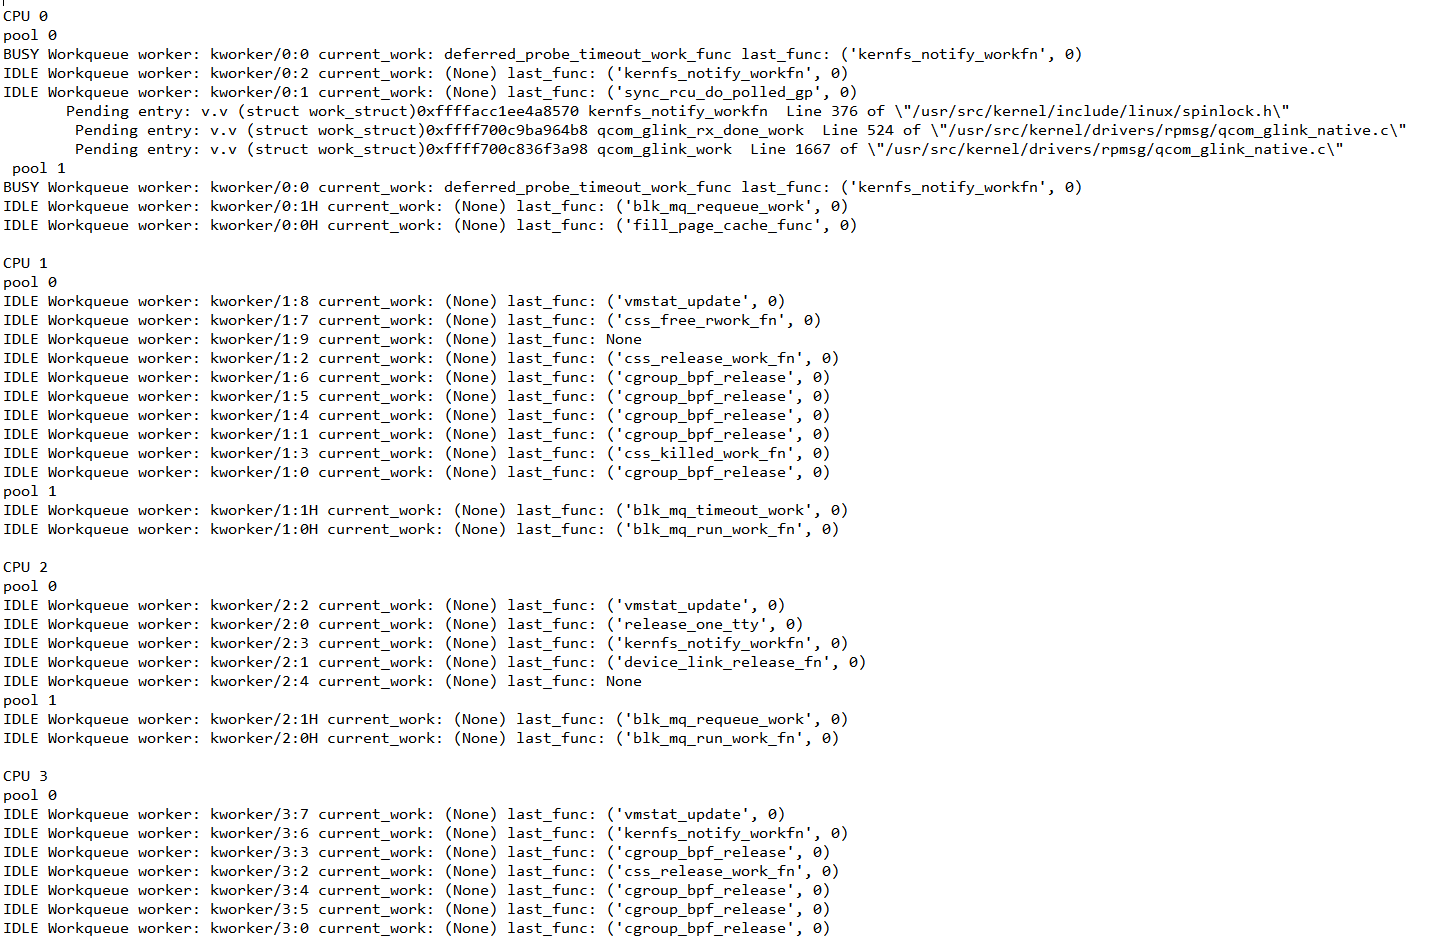
图:Workqueue(dmesg_TZ.txt)
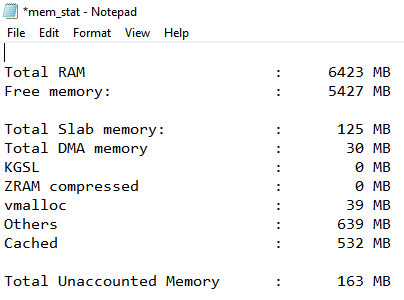
图:Memory statistics(mem_stat.txt)
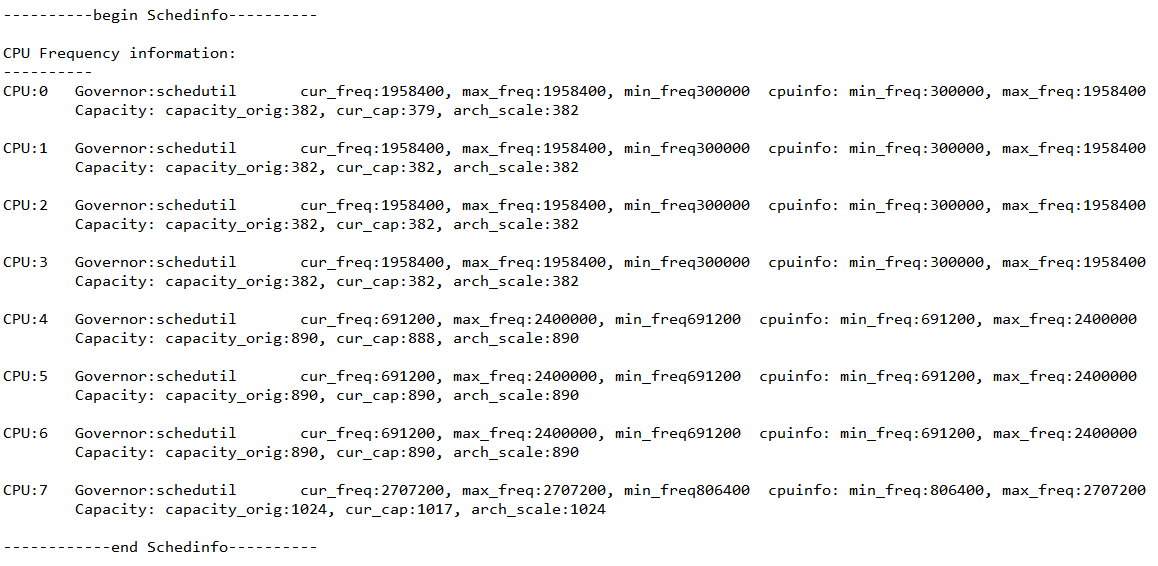
图:CPU frequency(dmesg_TZ.txt)
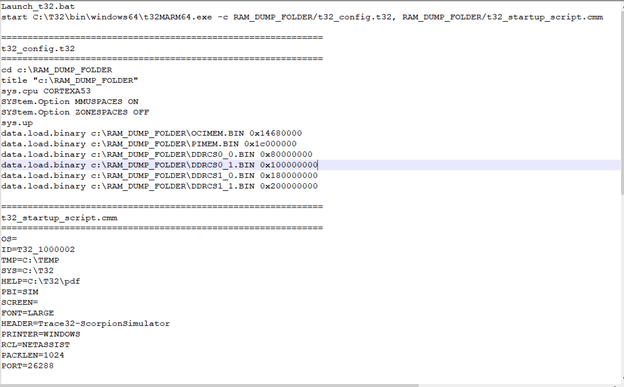
图:TRACE32 siulator launcher(launch_t32.bat)
Crash 实用程序
Crash Utility 是一个开源工具,用于使用基于 gdb 的命令行界面对 RAM 转储进行调试内核。
先决条件
-
kaslr_offset和值kimage_voffset默认情况下,内核地址空间布局随机化 (KASLR) 功能在 高通Linux 版本上处于启用状态。要使崩溃实用程序在支持 KASLR 的内核上运行,需要 和 参数的值,这些值可以从 RAMparser 输出文件 .
kaslr_offsetkimage_voffsetdmesg_TZ.txt以下是示例 RAMparser 输出文件 的摘录,提供了 和 值。
dmesg_TZ.txtkaslr_offsetkimage_voffset
The kaslr_offset extracted is: 0x340c3d320000
...
The kimage_voffset extracted is: ffffb40bbf600000
-
内核二进制文件的基址 (
DDRCS*.BIN)使用 PCAT 捕获 RAM 转储时,还会捕获文件。这些文件包含内核二进制文件 () 的基址。
dump_info.txtload.cmmDDRCS*.BIN
在 Linux 主机上下载并构建崩溃实用程序
要下载并构建崩溃实用程序,请运行以下命令:
git clone https://github.com/crash-utility/crash
make target=ARM64
make extensions=ARM64
有关更多信息,请参阅 crash/README at master ·crash-utility/crash·GitHub 的。
运行崩溃实用程序
以下是在 Ubuntu 主机上运行崩溃实用程序的示例命令:
./crash <PATH>/vmlinux <PATH>/DDRCS0_0.BIN@0x80000000,<PATH>/DDRCS1_0.BIN@0x100000000,<PATH>/DDRCS1_1.BIN@0x180000000 -m vabits_actual=48 -m max_physmem_bits=48 -m kimage_voffset=0xffffb40bbf600000 --kaslr=0x340c3d320000
-
替换为 vmlinux RAM 转储路径。
<PATH> -
kimage_voffset从 RAMparser 输出中提取 文件。kaslrdmesg_TZ.txt -
DDR 偏移量,例如从使用 PCAT 收集的 RAM 转储中可用的文件中提取的。
0x80000000dump_info.txt
输出示例:
crash 8.0.4
Copyright (C) 2002-2022 Red Hat, Inc.
Copyright (C) 2004, 2005, 2006, 2010 IBM Corporation
Copyright (C) 1999-2006 Hewlett-Packard Co
Copyright (C) 2005, 2006, 2011, 2012 Fujitsu Limited
Copyright (C) 2006, 2007 VA Linux Systems Japan K.K.
Copyright (C) 2005, 2011, 2020-2022 NEC Corporation
Copyright (C) 1999, 2002, 2007 Silicon Graphics, Inc.
Copyright (C) 1999, 2000, 2001, 2002 Mission Critical Linux, Inc.
Copyright (C) 2015, 2021 VMware, Inc.
This program is free software, covered by the GNU General Public License,
and you are welcome to change it and/or distribute copies of it under
certain conditions. Enter "help copying" to see the conditions.
This program has absolutely no warranty. Enter "help warranty" for details.

NOTE: setting vabits_actual to: 48

NOTE: setting max_physmem_bits to: 48
GNU gdb (GDB) 10.2
Copyright (C) 2021 Free Software Foundation, Inc.
License GPLv3+: GNU GPL version 3 or later <http://gnu.org/licenses/gpl.html>
This is free software: you are free to change and redistribute it.
There is NO WARRANTY, to the extent permitted by law.
Type "show copying" and "show warranty" for details.
This GDB was configured as "--host=x86_64-pc-linux-gnu --target=aarch64-elf-linux".
Type "show configuration" for configuration details.
Find the GDB manual and other documentation resources online at:
<http://www.gnu.org/software/gdb/documentation/>.

For help, type "help".
Type "apropos word" to search for commands related to "word"...

WARNING: cpu 0: cannot find NT_PRSTATUS note
WARNING: cpu 1: cannot find NT_PRSTATUS note
WARNING: cpu 2: cannot find NT_PRSTATUS note
WARNING: cpu 3: cannot find NT_PRSTATUS note
WARNING: cpu 4: cannot find NT_PRSTATUS note
WARNING: cpu 5: cannot find NT_PRSTATUS note
WARNING: cpu 6: cannot find NT_PRSTATUS note
WARNING: cpu 7: cannot find NT_PRSTATUS note
KERNEL: /test/vmlinux [TAINTED]
DUMPFILES: /var/tmp/ramdump_elf_PBaLfj [temporary ELF header]
/test/DDRCS0_0.BIN
/test/DDRCS1_0.BIN
/test/DDRCS1_1.BIN
CPUS: 8 [OFFLINE: 7]
DATE: Sun Jan 6 05:30:34 +0530 1980
UPTIME: 00:00:48
LOAD AVERAGE: 1.60, 0.51, 0.18
TASKS: 532
RELEASE: 6.6.17-debug
VERSION: #1 SMP PREEMPT Mon Mar 25 04:52:52 UTC 2024
MACHINE: aarch64 (unknown Mhz)
MEMORY: 5.5 GB
PANIC: "Kernel panic - not syncing: sysrq triggered crash"
PID: 1419
COMMAND: "sh"
TASK: ffff1756f61ea000 [THREAD_INFO: ffff1756f61ea000]
CPU: 0
STATE: TASK_RUNNING (PANIC)
crash> man
* files mod sbitmapq union
alias foreach mount search vm
ascii fuser net set vtop
bpf gdb p sig waitq
bt help ps struct whatis
btop ipcs pte swap wr
dev irq ptob sym q
dis kmem ptov sys
eval list rd task
exit log repeat timer
extend mach runq tree

crash version: 8.0.4 gdb version: 10.2
For help on any command above, enter "help <command>".
For help on input options, enter "help input".
For help on output options, enter "help output".
crash> log
[ 0.000000] Booting Linux on physical CPU 0x0000000000 [0x412fd050]
[ 0.000000] Linux version 6.6.17-debug (oe-user@oe-host) (aarch64-qcom-linux-gcc (GCC) 11.4.0, GNU ld (GNU Binutils) 2.38.20220708) #1 SMP PREEMPT Mon Mar 25 04:52:52 UTC 2024
[ 0.000000] KASLR enabled
[ 0.000000] Machine model: Qualcomm Technologies, Inc. Robotics RB3gen2 addons vision mezz platform
[ 0.000000] efi: EFI v2.7 by Qualcomm Technologies, Inc.
[ 0.000000] efi: MEMATTR=0x9ccf6018 INITRD=0x9cceaf18 RNG=0x9cce3018 MEMRESERVE=0x9ccea818
[ 0.000000] random: crng init done
[ 0.000000] Reserved memory: created CMA memory pool at 0x00000000fd000000, size 12 MiB
[ 0.000000] OF: reserved mem: initialized node adsp-heap, compatible id shared-dma-pool
crash> p memdump
memdump = $1 = {
table_phys = 4110417920,
table = 0xffff80008087d000
}
有关 crash 实用程序的更多信息,请参阅以下内容:


 1万+
1万+

 被折叠的 条评论
为什么被折叠?
被折叠的 条评论
为什么被折叠?
 到【灌水乐园】发言


