


Linux 用户空间问题调试:从基础工具到高级策略的进阶指南
下图显示了可用于调试与 Linux 用户空间应用程序相关的问题的开源工具、转储和日志。
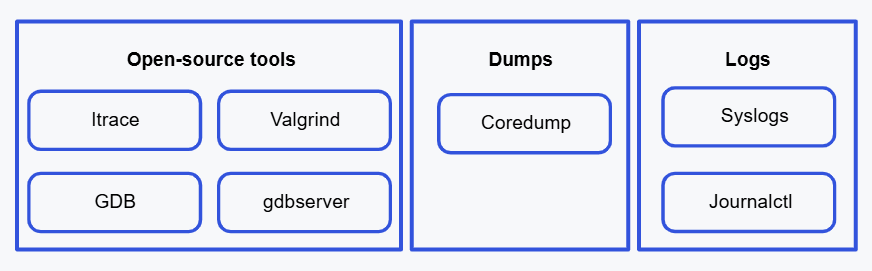
图:用于调试 Linux 用户空间中问题的资源
支持的开源调试工具是使用 BitBake 文件启用的。此 BitBake 文件 可在以下网址获得: 。此处介绍了启用和使用开源工具(如 ltrace)的过程。packagegroup-core-tools-debug.bbappend``layers/meta-qcom-hwe/recipes-devtools/packagegroups/
使用 ltrace 进行调试
默认情况下,在构建中启用 ltrace。
先决条件
设置 SSH。
程序
要使用 ltrace 进行调试,请使用 SSH 运行以下命令:
-
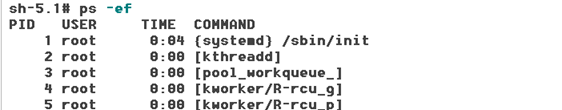
运行 process status 命令:
ps -ef输出示例:
339 rpc 0:00 /usr/sbin/rpcbind -w -f
345 root 0:00 /lib/systemd/systemd-journald
373 root 0:00 [kworker/3:6-mm_]
-
确定要调试的进程的进程 ID (PID)。
-
运行命令:
ltraceltrace -p 345在此示例中,是 PID。
345输出示例:
journal_file_close(0x25e30170, -1, 0, 0 <unfinished ...>
sockaddr_un_unlink(0x25e30170, -1, 0, 0
<unfinished ...>
sd_journal_close(0x25e31c00, 1, 3, 0x409e70) = 0
sd_journal_close(0x25e31d50, 1, 0, 1) = 0
<... sockaddr_un_unlink resumed> ) = 1
<... journal_file_close resumed> ) = 1
journal_file_close(0x25e30170, -1, 0, 0 <unfinished ...>
sockaddr_un_unlink(0x25e30170, -1, 0, 0 <unfinished ...>
sd_event_now(15, 0x41ed20, 10, 64) = 10
openat64(2, 0x41ed20, 10, 64 <unfinished ...>
clock_gettime(2, 0x41ed20, 10, 64) = 6
使用 Valgrind 进行调试
Valgrind 工具可以检测 C 和 C++ 程序中常见的内存相关错误。这些错误会导致崩溃和不可预知的行为,例如内存泄漏和内存损坏。默认情况下,Valgrind 工具在构建中处于启用状态。
先决条件
设置 SSH。
程序
要使用 Valgrind 工具,请执行以下作:
-
将调试符号推送到设备。
-
在设备上运行 Valgrind 工具。
valgrind --tool=memcheck --leak-check=yes --show-reachable=yes --num-callers=20 --track-fds=yes /usr/bin/tqftpserv输出示例:
==622== Memcheck, a memory error detector
==622== Copyright (C) 2002-2017, and GNU GPL'd, by Julian Seward et al.
==622== Using Valgrind-3.18.1 and LibVEX; rerun with -h for copyright info
==622== Command: /usr/bin/tqftpserv
==622==

^C==622==
==622== Process terminating with default action of signal 2 (SIGINT)
==622== at 0x498EF38: select (select.c:69)
==622== by 0x4013CB: ??? (in /usr/bin/tqftpserv)
==622== by 0x48DB1AF: (below main) (libc_start_call_main.h:58)
==622==
==622== FILE DESCRIPTORS: 4 open (3 std) at exit.
==622== Open pf-42 socket 3:
==622== at 0x49984CC: socket (syscall-template.S:120)
==622== by 0x4891293: qrtr_open (in /usr/lib/libqrtr.so.1.0)
==622== by 0x40129B: ??? (in /usr/bin/tqftpserv)
==622== by 0x48DB1AF: (below main) (libc_start_call_main.h:58)
==622==
==622==
==622== HEAP SUMMARY:
==622== in use at exit: 0 bytes in 0 blocks
==622== total heap usage: 0 allocs, 0 frees, 0 bytes allocated
==622==
==622== All heap blocks were freed -- no leaks are possible
==622==
==622== For lists of detected and suppressed errors, rerun with: -s
==622== ERROR SUMMARY: 0 errors from 0 contexts (suppressed: 0 from 0)
==622== ERROR SUMMARY: 0 errors from 0 contexts (suppressed: 0 from 0)
使用 GDB 进行调试
默认情况下,GNU 调试器 (GDB) 在构建中未启用。要启用 GDB,请在 Linux 主机上执行以下作:
-
导航到目录并打开文件。
layers/meta-qcom-hwe/recipes-devtools/packagegroups/``packagegroup-core-tools-debug.bbappend -
验证调试符号是否已启用。
readelf --debug-dump=decodedline <BIN_FILE>或
objdump --syms <BIN_NAME> | grep -i ‘debug’如果未启用调试符号,请使用 CFLAG 编译所有必需的可执行文件或共享库。
-g -
修改要添加到包列表中的文件。如果软件包名称已在软件包列表中,请跳过此步骤。
packagegroup-core-tools-debug.bbappend``gdb -
在设备上重新编译并刷写 build。
要使用 GDB 进行调试,请在设备上运行以下命令:
gdb --pid 502
输出示例:
gdb: warning: Couldn't determine a path for the index cache directory.
GNU gdb (GDB) 11.2
Copyright (C) 2022 Free Software Foundation, Inc.
License GPLv3+: GNU GPL version 3 or later <http://gnu.org/licenses/gpl.html>
This is free software: you are free to change and redistribute it.
There is NO WARRANTY, to the extent permitted by law.
Type "show copying" and "show warranty" for details.
This GDB was configured as "aarch64-qcom-linux".
Type "show configuration" for configuration details.
For bug reporting instructions, please see:
<https://www.gnu.org/software/gdb/bugs/>.
Find the GDB manual and other documentation resources online at:
<http://www.gnu.org/software/gdb/documentation/>.
For help, type "help".
Type "apropos word" to search for commands related to "word".
Attaching to process 502
Reading symbols from /usr/bin/tqftpserv...
(No debugging symbols found in /usr/bin/tqftpserv)
Reading symbols from /usr/lib/libqrtr.so.1...
(No debugging symbols found in /usr/lib/libqrtr.so.1)
Reading symbols from /lib/libc.so.6...
Reading symbols from /lib/.debug/libc.so.6...
Reading symbols from /lib/ld-linux-aarch64.so.1...
Reading symbols from /lib/.debug/ld-linux-aarch64.so.1...
[Thread debugging using libthread_db enabled]
Using host libthread_db library "/lib/libthread_db.so.1".
0x0000ffffab00ef34 in __GI___select (nfds=4, readfds=0xffffc2ec14f8, writefds=0x0, exceptfds=0x0, timeout=0x0) at ../sysdeps/unix/sysv/linux/select.c:69
69 ../sysdeps/unix/sysv/linux/select.c: No such file or directory.
(gdb)
(gdb)
(gdb)
(gdb)
下表列出了常用的 GDB 命令。
表:常见的 GDB 命令
| 命令 | 描述 |
|---|---|
(gdb) bt | 提供当前线程的回溯。 |
(gdb) info threads | 列出当前已知线程的 ID。 |
(gdb) thread 2 | 切换到线程 2。 |
(gdb) where | 显示当前行号和您所在的函数。 |
(gdb) thread apply all bt full | 提供所有线程的回溯。 |
(gdb) info sharedlibrary | 列出使用的共享库的名称。 |
(gdb) info reg | 列出 CPU 寄存器。 |
收集核心转储
核心转储是用户空间进程的内存快照,可用于分析进程崩溃的原因。
根据 Yocto Linux 标准收集所有用户空间进程崩溃的核心转储。默认情况下,核心转储在构建中处于启用状态。生成的核心转储保存在设备上的 。/var/coredump
要验证核心转储的位置,请运行以下命令:
cat /proc/sys/kernel/core_pattern
输出示例:
/var/coredump/%e.core
核心转储的大小必须大于 0 (零) 。要验证核心转储的大小,请运行以下命令:
ulimit -c
输出示例:
unlimited
如果未启用核心转储,请使用以下文件来启用它:
layers/meta-qcom-distro/recipes-products/packagegroups/packagegroup-qcom.bb.
RDEPENDS:packagegroup-support-utils = "\
   chrony \
   libinput \
   libinput-bin \
   libnl \
   libxml2 \
+++ procps \
   "
注意
使用此补丁启用核心转储时,必须重新构建并重新刷写设备。
在核心转储上使用 GDB
要生成核心转储,您需要强制终止进程。为此,请运行以下命令:
ps -ef | grep -i 'tqftp*'
输出示例:
root 1024 1 0 17:46 ? 00:00:00 /usr/bin/tqftpserv
root 1047 934 0 17:47 pts/0 00:00:00 grep -i tqftp*
kill -11 1024
cd /var/coredump
ls
输出示例:
tqftpserv.core
这是核心转储文件。tqftpserv.core
如果调试符号已推送到设备,请运行以下命令以在核心转储上使用 GDB 工具:
cd /usr/bin/
gdb tqftpserv /var/coredump/tqftpserv.core
输出示例:
gdb: warning: Couldn't determine a path for the index cache directory.
GNU gdb (GDB) 11.2
Copyright (C) 2022 Free Software Foundation, Inc.
License GPLv3+: GNU GPL version 3 or later <http://gnu.org/licenses/gpl.html>
This is free software: you are free to change and redistribute it.
Type "apropos word" to search for commands related to "word"...
Reading symbols from tqftpserv...

warning: exec file is newer than core file.
[New LWP 1024]
[Thread debugging using libthread_db enabled]
Using host libthread_db library "/lib/libthread_db.so.1".
Core was generated by `/usr/bin/tqftpserv'.
Program terminated with signal SIGSEGV, Segmentation fault.
#0 0x0000ffff8629ef34 in __GI___select (nfds=4,
readfds=readfds@entry=0xffffd04ccb28, writefds=writefds@entry=0x0,
--Type <RET> for more, q to quit, c to continue without paging--
exceptfds=exceptfds@entry=0x0, timeout=timeout@entry=0x0)
at ../sysdeps/unix/sysv/linux/select.c:69
69 ../sysdeps/unix/sysv/linux/select.c: No such file or directory.
(gdb) bt
#0 0x0000ffff8629ef34 in __GI___select (nfds=4,
readfds=readfds@entry=0xffffd04ccb28, writefds=writefds@entry=0x0,
exceptfds=exceptfds@entry=0x0, timeout=timeout@entry=0x0)
at ../sysdeps/unix/sysv/linux/select.c:69
#1 0x00000000004013cc in main (argc=<optimized out>, argv=<optimized out>)
at tqftpserv.c:552
Backtrace stopped: previous frame identical to this frame (corrupt stack?)
(gdb)
使用 gdbserver 进行调试
gdbserver 实用程序允许您从 Linux 主机远程运行 GDB 工具。当设备上存在调试符号的存储限制时,此实用程序有助于调试问题。
在设备上启用 gdbserver
默认情况下,gdbserver 在构建中未启用。要启用 gdbserver,请执行以下作:
-
转到目录并打开文件。
layers/meta-qcom-hwe/recipes-devtools/packagegroups/``packagegroup-core-tools-debug.bbappend -
修改文件以添加到 package 列表中。
packagegroup-core-tools-debug.bbappend``gdbserver -
在设备上重新编译并刷写 build。
在设备上配置 gdbserver
要在设备上配置 gdbserver,请使用 SSH 运行以下命令:
mount -o rw,remount /
gdbserver :8888 <path-to-binary>
例如:
gdbserver :8888 /usr/bin/tqftpserv
输出示例:
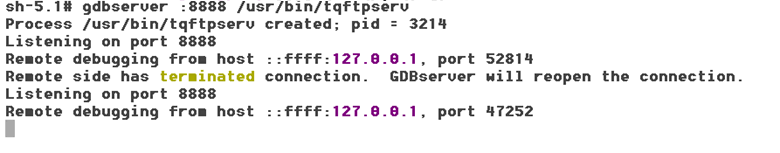
示例输出指示设备已准备好与 Linux 主机通信。
在 Linux 主机上配置 gdb
要在 Linux 主机上配置 gdb 工具,请执行以下作:
-
安装 gdb 和 gdb-multiarch 工具。
sudo apt-get install gdb gdb-multiarch -
创建一个调试目录以捕获构建中的所有符号。
mkdir test_gdbserver -
将具有调试符号的 rootfs 从生成位置复制到调试目录。
test_gdbservercp -f <ENTER_PATH>/build-qcom-wayland/tmp-glibc/deploy/images/<chipset>/qcom-multimedia-image-<chipset>-dbg.rootfs.tar.bz2 test_gdbservercd test_gdbservertar -xvf qcom-multimedia-image-<chipset>-dbg.rootfs.tar.bz2注意
运行这些命令时,请替换为下表中指定的适当值。
<chipset>芯片组 价值 QCS6490 qcm6490QCS5430 qcm6490QCS8275 qcs8300QCS9075 qcs9100现在已准备好符号。
test_gdbserver -
使用命令启动 gdb-multiarch 工具。
gdb-multiarch <EXECUTABLE_PATH>例如
gdb-multiarch test_gdbserver/usr/bin/tqftpservgdb-multiarch 工具将在 gdb 控制台上启动。
-
在 gdb 控制台上运行以下命令:
set gnutarget elf64-littleaarch64设置 sysroot 。
set sysroot <ENTER_PATH>/test_gdbservertarget remote <target_ip>:8888btbinfo threads
以下屏幕截图显示了配置过程的示例输出。
$ gdb-multiarch /test_gdbserver/usr/bin/.debug/tqftpserv
GNU gdb (Ubuntu 9.2-0ubuntu1~20.04.2) 9.2
Copyright (C) 2020 Free Software Foundation, Inc.
License GPLv3+: GNU GPL version 3 or later http://gnu.org/licenses/gpl.html
This is free software: you are free to change and redistribute it.
There is NO WARRANTY, to the extent permitted by law.
Type "show copying" and "show warranty" for details.
This GDB was configured as "x86_64-linux-gnu".
Type "show configuration" for configuration details.
For bug reporting instructions, please see:
http://www.gnu.org/software/gdb/bugs/.
Find the GDB manual and other documentation resources online at:
http://www.gnu.org/software/gdb/documentation/.
Reading symbols from /test_gdbserver/usr/bin/.debug/tqftpserv...
(gdb) set gnutarget elf64-littleaarch64
(gdb) set sysroot /test_gdbserver
(gdb) target remote 10.92.168.78:8888
Remote debugging using 10.92.168.78:8888
warning: while parsing target description (at line 71): Vector "v8bf16" references undefined type "bfloat16"
warning: Could not load XML target description; ignoring
warning: Unable to find dynamic linker breakpoint function.
Reading symbols from /test_gdbserver/lib/ld-linux-aarch64.so.1...
(no debugging symbols found)...done.
Reading symbols from /test_gdbserver/lib/.debug/ld-linux-aarch64.so.1...
Loaded symbols for /test_gdbserver/lib/.debug/ld-linux-aarch64.so.1
warning: no loadable sections found in added symbol-file system-supplied DSO at 0xfffff7ffb000
0x0000fffff7fda870 in _start ()
from /test_gdbserver/lib/.debug/ld-linux-aarch64.so.1
(gdb) bt
#0 0x0000fffff7fda870 in _start ()
from /test_gdbserver/lib/.debug/ld-linux-aarch64.so.1
#1 0x0000000000000000 in ?? ()
(gdb) b
Breakpoint 1 at 0xfffff7fda870
(gdb) info threads
Id Target Id Frame
* 1 Thread 3212 0x0000fffff7fda870 in _start ()
(gdb)
使用用户空间日志进行调试
以下日志可用于调试在设备上使用 SSH 的用户空间中的问题。
系统日志
要验证是否生成了 syslog,请运行以下命令:
cat /var/log/user.log
如果未生成 syslog,请运行以下命令:
tail -f /var/log/messages
示例日志:
Apr 28 17:42:30 qcm6490 daemon.info avahi-daemon[516]: No service file found in /etc/avahi/services.
Apr 28 17:42:30 qcm6490 daemon.info avahi-daemon[516]: Joining mDNS multicast group on interface lo.IPv6 with address ::1.
Apr 28 17:42:30 qcm6490 daemon.info avahi-daemon[516]: New relevant interface lo.IPv6 for mDNS.
Apr 28 17:42:30 qcm6490 daemon.info avahi-daemon[516]: Joining mDNS multicast group on interface lo.IPv4 with address 127.0.0.1.
Apr 28 17:42:30 qcm6490 daemon.info avahi-daemon[516]: New relevant interface lo.IPv4 for mDNS.
journalctl 日志
要生成 systemd journalctl 日志,请运行以下命令:
journalctl -ef
示例日志:
Apr 28 17:42:28 qcm6490 kernel: spmi-temp-alarm c440000.spmi:pmic@2:temp-alarm@2400: error -ENXIO: IRQ index 0 not found
Apr 28 17:42:28 qcm6490 kernel: qcom-spmi-adc5 c440000.spmi:pmic@2:adc@3100: Invalid dig version read -19
Apr 28 17:42:28 qcm6490 kernel: qcom-spmi-adc5 c440000.spmi:pmic@2:adc@3100: error -ENODEV: adc get dt data failed
Apr 28 17:42:28 qcm6490 kernel: qcom-spmi-adc5 c440000.spmi:pmic@0:adc@3100: error -EINVAL: adc get dt data failed
Apr 28 17:42:28 qcm6490 kernel: qcom-spmi-adc5: probe of c440000.spmi:pmic@0:adc@3100 failed with error -22
Apr 28 17:42:28 qcm6490 kernel: dwc3 a600000.usb: Adding to iommu group
Apr 28 17:42:29 qcm6490 systemd[1]: First Boot Complete was skipped because of a failed condition check (ConditionFirstBoot=yes).
Apr 28 17:42:29 qcm6490 systemd[1]: Reached target Hardware activated USB gadget.
配置调试符号
需要调试符号来解析核心转储。Yocto Linux 在设计上编译一个包并将其拆分为多个包。例如,如果文件编译文件,则会生成多个包。hello_0.1.bb``hello.cpp
下表列出了与核心转储相关的软件包。
Table : 解析核心转储所需的软件包
| 包 | 描述 |
|---|---|
hello_0.1-r0_armv8-2a.ipk | 此包包含剥离的可执行文件。它是设备映像中包含的唯一软件包。 |
hello-dbg_0.1-r0_armv8-2a.ipk | 此包包含调试符号,并且永远不会打包到映像中。调试包 (-dbg) 会显著增加映像大小,这会导致在映像中包含此包时出现问题。此外,除了调试之外,此包没有运行时值。因此,作为一种策略,Yocto 不会在映像中包含任何 -dbg 包。 |
hello-dev_0.1-r0_armv8-2a.ipk | 此包包含从属模块在编译期间使用的导出头文件和库。 |
根据 Yocto Linux 标准,调试符号存储在构建位置路径中:。例如,package 包含目录的调试符号。tmp-glibc/deploy/ipk/armv8-2a``tqftpserv-dbg_0.0+0+de42697a24-r0_armv8-2a.ipk``/usr/bin/tqftpserv
要将调试符号推送到设备,请使用 SSH 执行以下作:
-
重新挂载 rootfs。
mount -o rw,remount / -
使用该命令,将调试符号 () 推送到设备中任何可用分区,例如 .
scp``tqftpserv-dbg_0.0+0+de42697a24-r0_armv8-2a.ipk``/data/chmod 777 /data/tqftpserv-dbg_0.0+0+de42697a24-r0_armv8-2a.ipkcd data -
在设备上安装调试符号。
opkg install --nodeps tqftpserv-dbg_0.0+0+de42697a24-r0_armv8-2a.ipk
将调试符号推送到设备后,符号将保存在该目录下可执行目录的路径下。例如,对于目录,调试符号保存在该目录中。.debug``/usr/bin/tqftpserv``/usr/bin/.debug
要识别设备上可用的调试符号,请运行以下命令:
cd /usr/bin/.debug
ls
输出示例:
Gencat getent locale pcprofiledump sprof zdump

getconf iconv makedb pldd tqftpserv
重新启动命令
用户空间重启框架使用内核驱动程序 () 触发重启。可以使用 SSH 运行以下重启命令:drivers/firmware/psci/psci.c
表:重新启动命令
| 命令 | 描述 |
|---|---|
reboot edl | 此命令将设备重启至紧急下载 (EDL) 模式。 |
reboot bootloader | 此命令将设备重启至 Fastboot 模式。 |
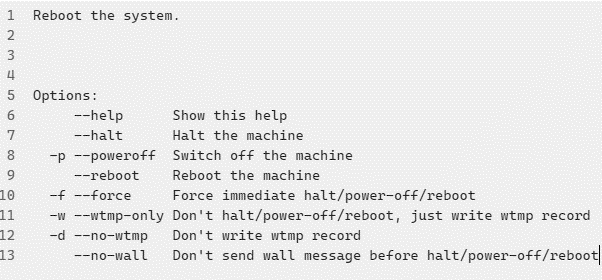
以下是可用于该命令的可选参数。reboot


 5232
5232

 被折叠的 条评论
为什么被折叠?
被折叠的 条评论
为什么被折叠?
 到【灌水乐园】发言


