


第四部分:数据聚合与分组
在本章中,学习如何按组或类别识别和拆分DataFrame,以进行进一步的聚合或分析。 学习如何转换和过滤数据,包括如何检测异常值和估算缺失值。 了解如何有效地将数据分组到pandas中可以成为数据科学工具箱中非常强大的补充。
分类和分组
按多列分组
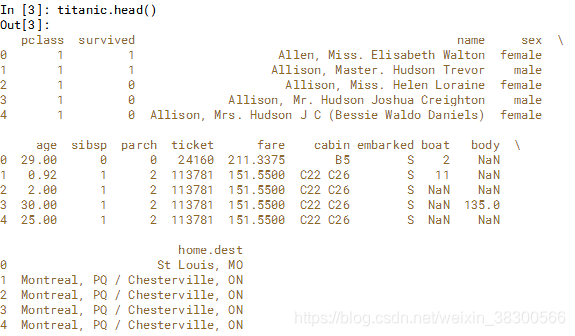
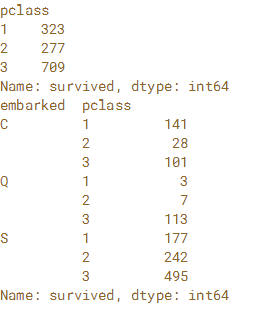
在本练习中,使用第1章中的泰坦尼克号数据集并使用.groupby()来分析登上泰坦尼克号的乘客的分布情况。'pclass'列标识乘客购买了哪一类机票,'embarked'列表示乘客登上泰坦尼克号的三个港口中的哪一个。 'S'代表英国南安普顿,'C'代表法国瑟堡,'Q'代表爱尔兰皇后镇。首先按'pclass'列进行分组,并使用'survived'列计算每个类中的行数。 然后按'embarked'和“pclass”列进行分组,并计算乘客数量。DataFrame已预先加载为 titanic。
# Group titanic by 'pclass'
by_class = titanic.groupby('pclass')

# Aggregate 'survived' column of by_class by count
count_by_class = by_class['survived'].count()

# Print count_by_class
print(count_by_class)

# Group titanic by 'embarked' and 'pclass'
by_mult = titanic.groupby(['embarked','pclass'])

# Aggregate 'survived' column of by_mult by count
count_mult = by_mult['survived'].count()

# Print count_mult
print(count_mult)
按另一Series分组
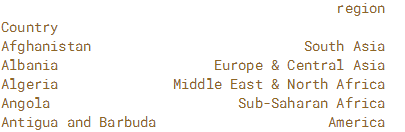
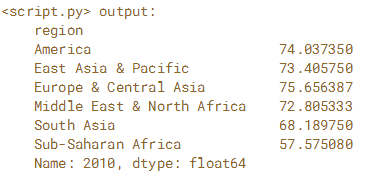
在本练习中,使用Gapminder.org的两个数据集来调查2010年6个大陆地区出生时的平均预期寿命(以年为单位)。 为此将每个国家/地区的预期寿命数据读入一个pandas DataFrame,并将国家和地区之间的关联读入另一个pandas DataFrame。
通过将两个DataFrame的索引设置为国家/地区名称,使用区域信息对预期寿命DataFrame中的国家/地区进行分组,并计算2010年的平均值。变量life_fname中使用预期寿命CSV文件,并且可以在变量regions_fname中使用区域文件名。
# Read life_fname into a DataFrame: life
life = pd.read_csv(life_fname, index_col='Country')
#print(life.head())

# Read regions_fname into a DataFrame: regions
regions = pd.read_csv(regions_fname, index_col='Country')
#print(regions.head())

# Group life by regions['region']: life_by_region
life_by_region = life.groupby(regions['region'])

# Print the mean over the '2010' column of life_by_region
print(life_by_region['2010'].mean())
分组和聚合
计算多列的多个聚合
.agg()方法可以与元组或聚合列表一起用作输入。 在多个列上应用多个聚合时,聚合的DataFrame具有多级列索引。
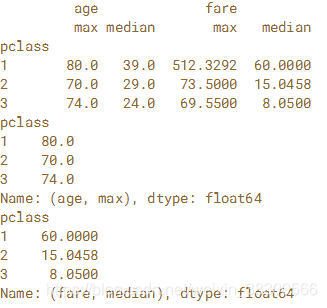
在本练习中,您通过'pclass'对泰坦尼克号上的乘客进行分组,并按功能'max'和'median'汇总'age'和'fare'列。 然后使用多级选择来查找每个班级最老的乘客和每个班级的中位数票价。DataFrame已预先加载为泰坦尼克号
# Group titanic by 'pclass': by_class
by_class = titanic.groupby('pclass')

# Select 'age' and 'fare'
by_class_sub = by_class[['age','fare']]

# Aggregate by_class_sub by 'max' and 'median': aggregated
aggregated = by_class_sub.agg(['max','median'])
#print(aggregated)

# Print the maximum age in each class
print(aggregated.loc[:, ('age','max')])

# Print the median fare in each class
print(aggregated.loc[:,('fare','median')])
根据索引级别进行分组
如果有一个具有多级行索引的DataFrame,则可以使用各个级别来执行groupby。 这允许高级聚合技术沿索引中的一个或多个级别以及跨一个或多个列应用。
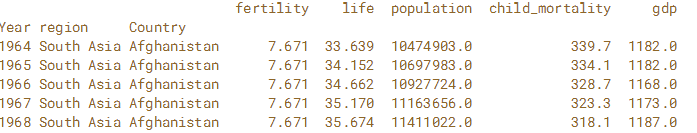
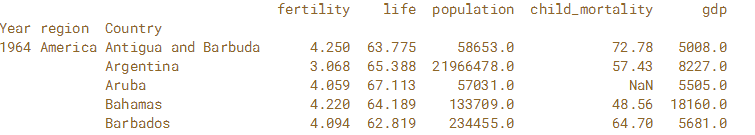
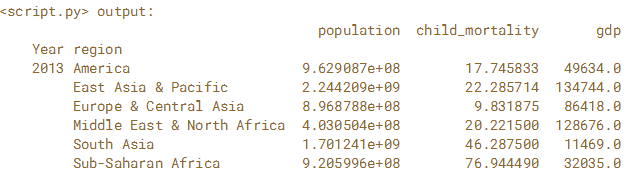
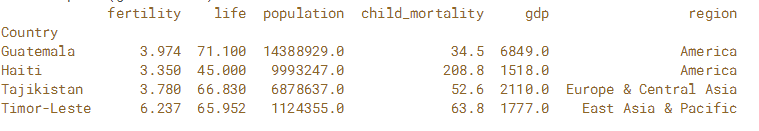
在本练习中,使用完整的Gapminder数据集,其中包含1964年至2013年世界上每个国家的预期寿命,人口,儿童死亡率(每1,000人)和人均国内生产总值(GDP)的年度值。创建列'Year','Region'和'Country'的多级DataFrame。 接下来,按'Year'和'Region'级别对DataFrame进行分组。 最后应用字典汇总来计算总人口,人均GDP值的差异和平均儿童死亡率。
# Read the CSV file into a DataFrame and sort the index: gapminder
gapminder = pd.read_csv('gapminder.csv',index_col=['Year','region','Country'])
gapminder = gapminder.sort_index()
print(gapminder.head())
# Group gapminder by 'Year' and 'region': by_year_region
by_year_region = gapminder.groupby(level=['Year','region'])

# Define the function to compute spread: spread
def spread(series):
    return series.max() - series.min()

# Create the dictionary: aggregator
aggregator = {'population':'sum', 'child_mortality':'mean', 'gdp':spread}

# Aggregate by_year_region using the dictionary: aggregated
aggregated = by_year_region[['population','child_mortality','gdp']].agg(aggregator)

# Print the last 6 entries of aggregated
print(aggregated.tail(6))
对索引的功能进行分组
也可以对索引值的转换执行Groupby操作。 在DateTimeIndex的情况下,我们可以提取要分组的日期时间的部分。
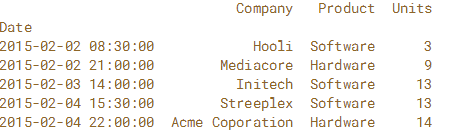
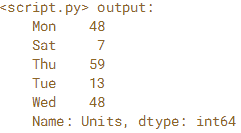
在本练习中,阅读2015年2月的一组样本销售数据,并将'Date'列指定为索引。 按星期几对销售数据进行分组,并汇总'Units'列的总和。是否有一周中哪一天更受客户欢迎? 要找到答案,使用.strftime('%a')将索引日期时间值转换为一周中的缩写天数。
销售数据CSV文件可用作“sales.csv”。
sales = pd.read_csv('sales.csv',index_col='Date')
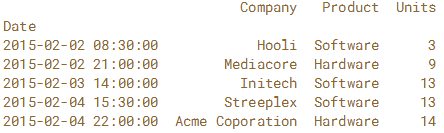
sales = pd.read_csv('sales.csv',index_col='Date',parse_dates=True)
# Read file: sales
#sales = pd.read_csv('sales.csv',index_col='Date')
sales = pd.read_csv('sales.csv',index_col='Date',parse_dates=True)

# Create a groupby object: by_day
by_day = sales.groupby(sales.index.strftime('%a'))

# Create sum: units_sum
units_sum = by_day['Units'].sum()
分组和转型
用 Z-Scores检测异常值
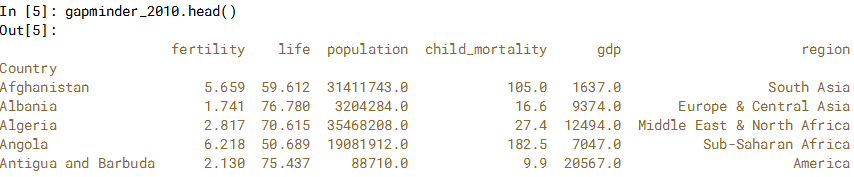
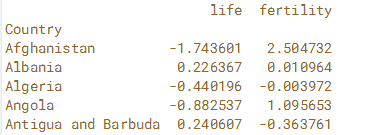
可以在分组后应用.transform()方法将函数独立应用于数据组。 Z-Scores对于查找异常值也很有用:通常认为+/- 3的 Z-Scores值是异常值。在这个例子中,通过每个区域的 Z-Scores标准化预期寿命和生育率。 使用布尔索引,过滤掉本地区生育率高和预期寿命低的国家/地区。由“Country”索引的2010年 Gapminder DataFrame将作为gapminder_2010提供
# Import zscore
from scipy.stats import zscore

# Group gapminder_2010: standardized
standardized = gapminder_2010.groupby('region')['life','fertility'].transform(zscore)
print(standardized.head())
# Construct a Boolean Series to identify outliers: outliers
outliers = (standardized['life'] < -3) | (standardized['fertility'] > 3)

# Filter gapminder_2010 by the outliers: gm_outliers
gm_outliers = gapminder_2010.loc[outliers]

# Print gm_outliers
print(gm_outliers)
按组填写缺失数据(插补)
许多统计和机器学习包无法确定遇到丢失数据条目时要采取的最佳操作。 处理丢失的数据在pandas 中很自然(使用默认行为和定义自定义行为)。 在第1章中,练习使用.dropna()方法删除缺失值。 现在,将练习输入缺失值。 可以使用.groupby()和.transform()为每个组适当填充缺少的数据。
为泰坦尼克号的乘客填写失踪的“age”值,其年龄中位数为'gender'和“pclass”。 为此按'sex'和“pclass”列进行分组,并使用自定义函数转换每个组以调用.fillna()并计算中值。DataFrame已预先加载为titanic。 通过打印titanic.tail(10)的输出在IPython Shell中探索它。 请特别注意“age”列中的NaN。
1111


 864
864

 被折叠的 条评论
为什么被折叠?
被折叠的 条评论
为什么被折叠?
 到【灌水乐园】发言


