


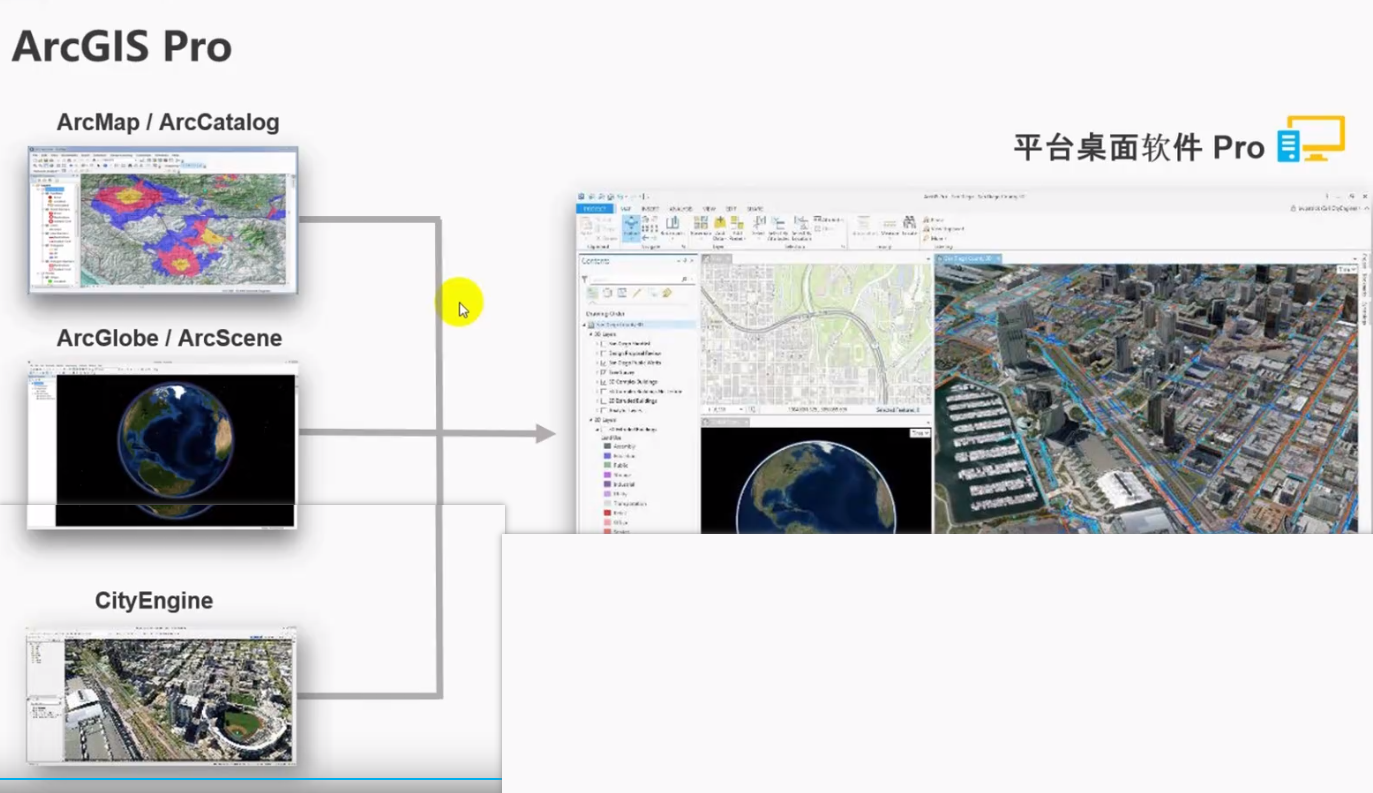
ArcGis体系架构:

ArcGis Pro 由三部分组成:ArcMap ArcGlobe CityEngine
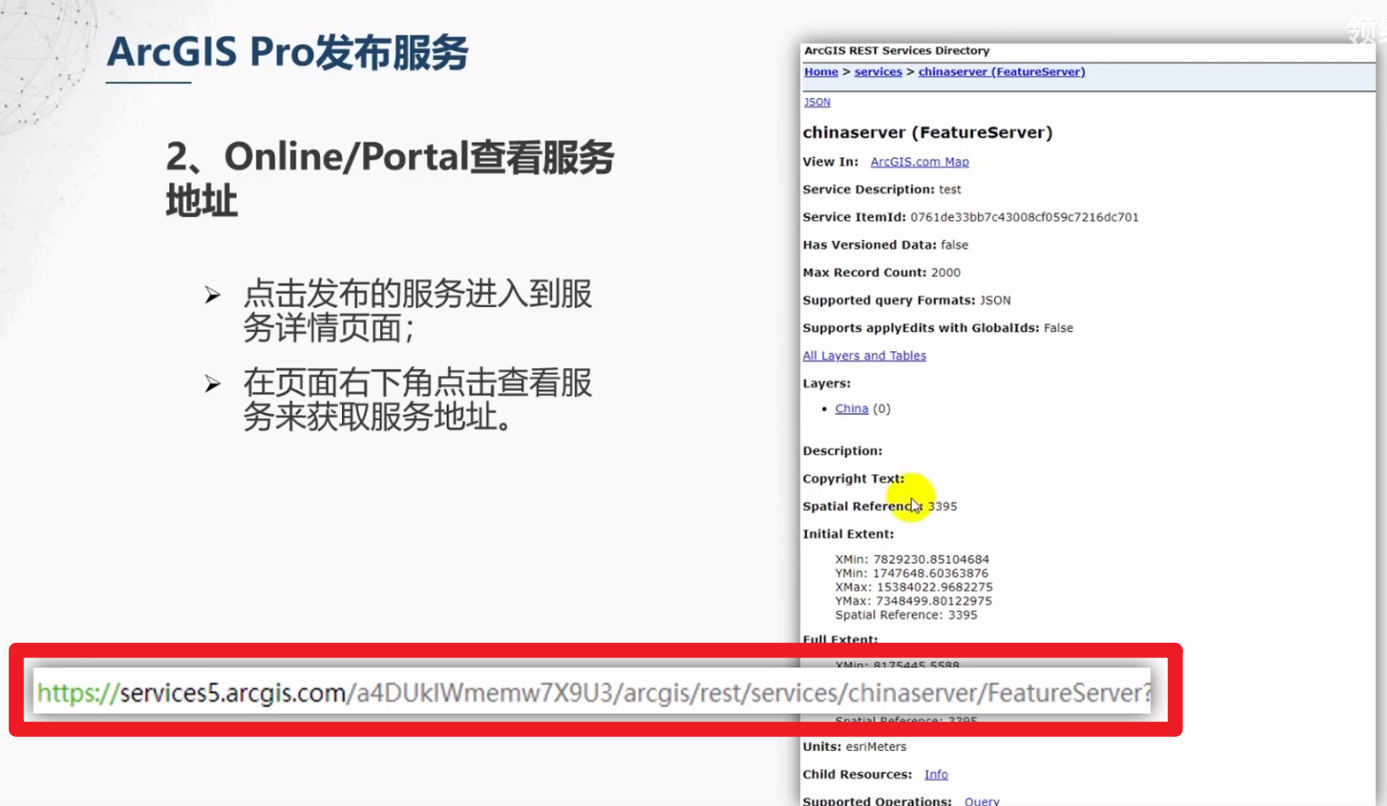
使用ArcGis Pro的流程:(最后要得到的是 服务地址!!)
1 配置Online (其中有Online的账号和密码的提前注册和使用)
2 导入数据
3 处理数据
4 发布服务
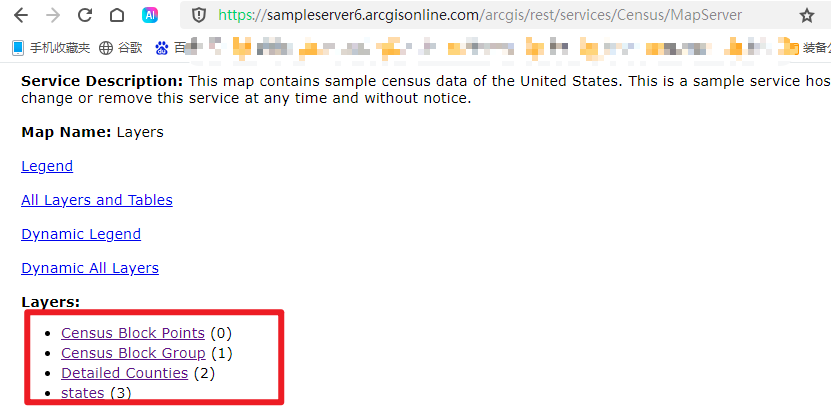
发布服务之后可以查看服务地址:
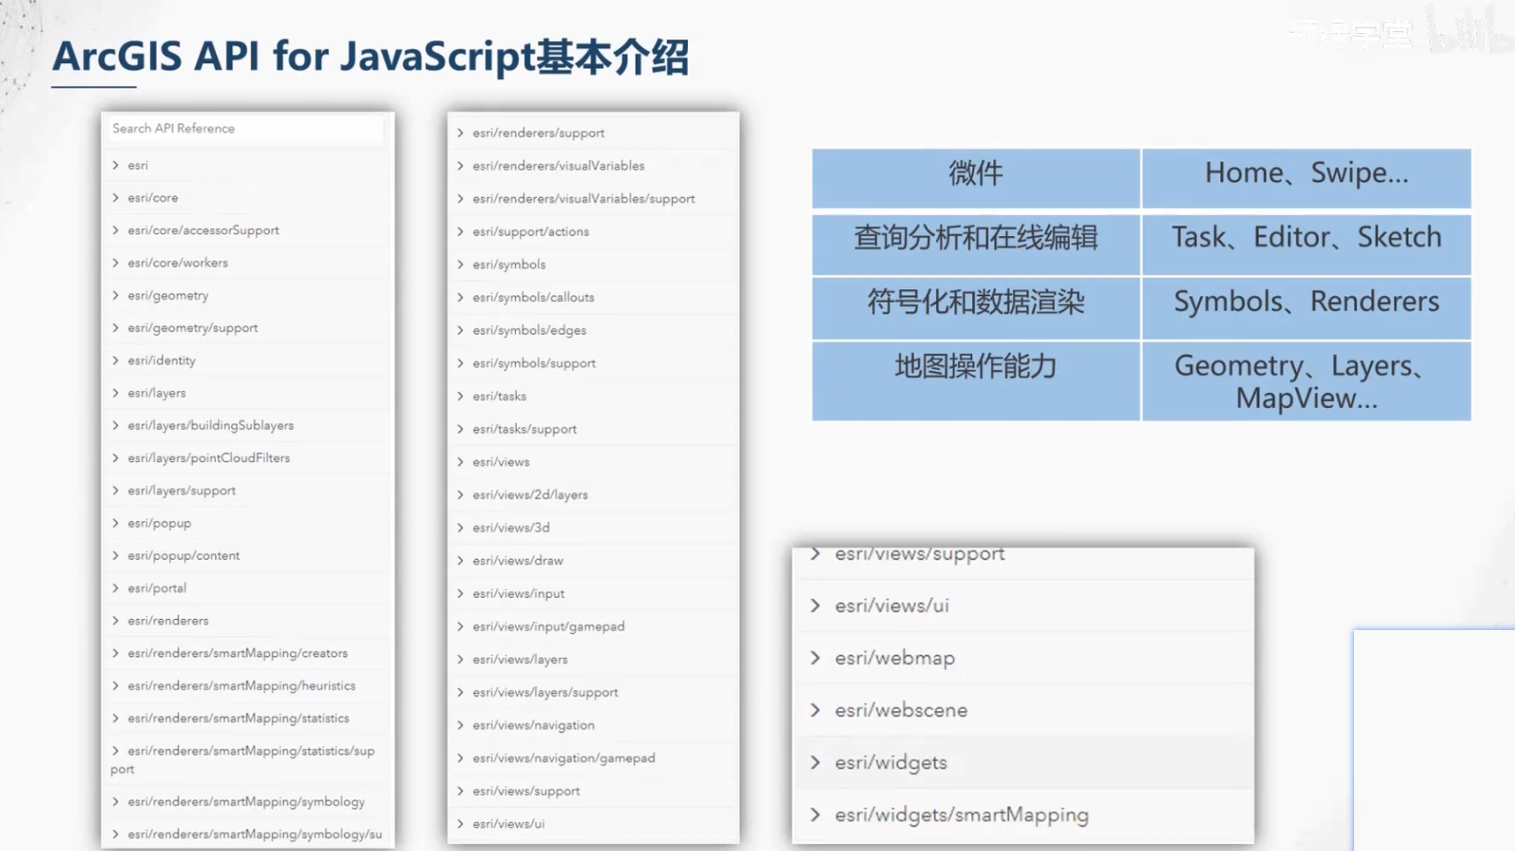
ArcGis JS API 基本介绍:
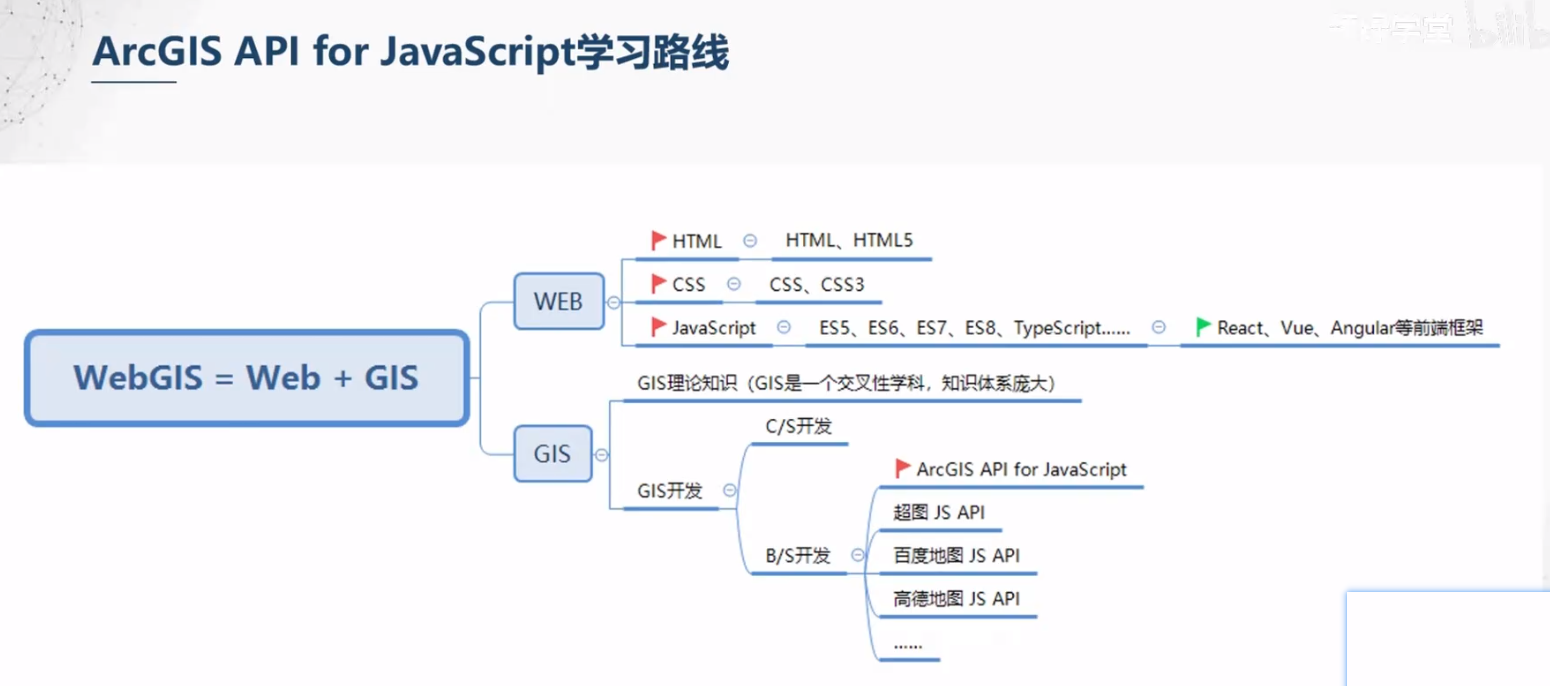
ArcGis学习路线:
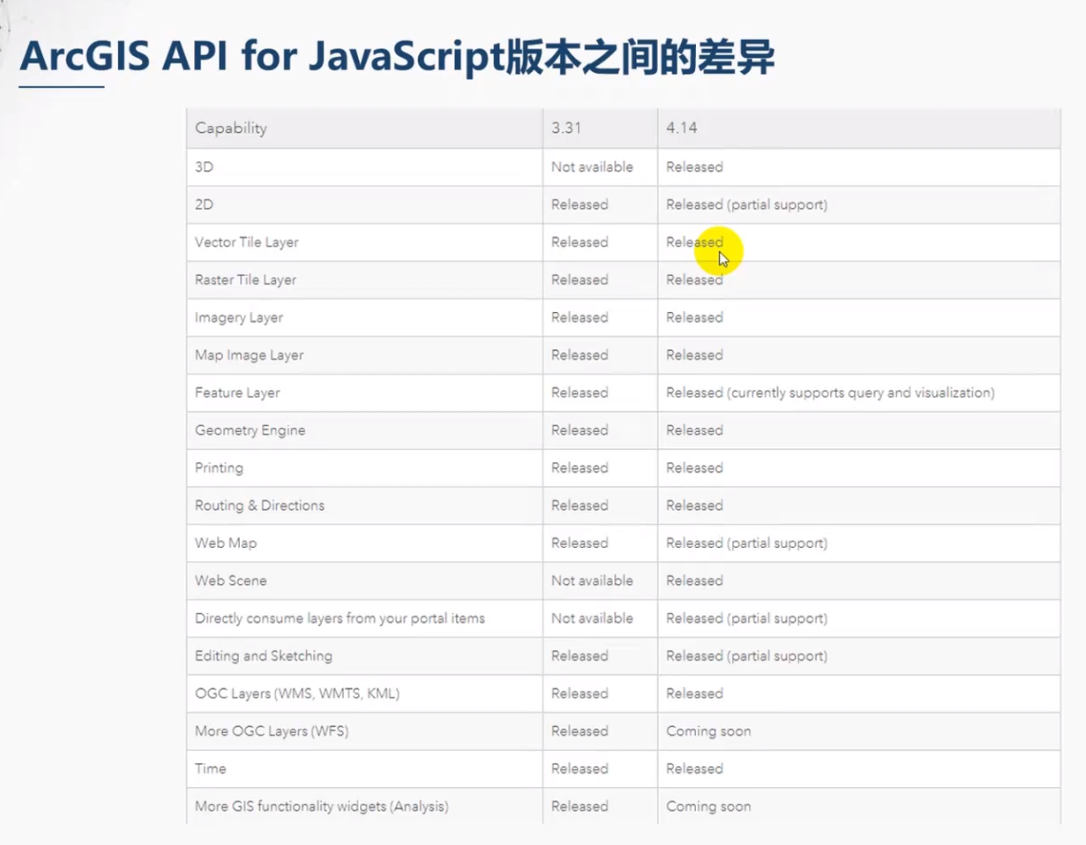
ArcGis JS API 3版本和4版本之间的区别:
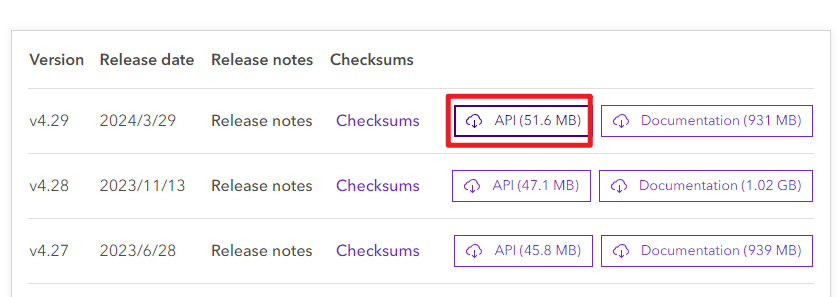
下载JS API:
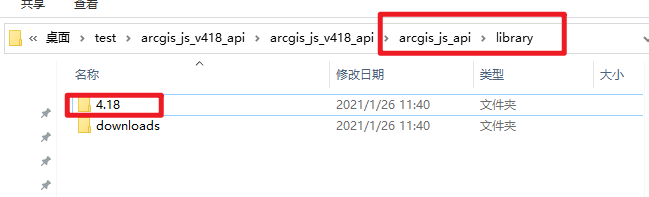
拷贝API文件到项目根目录:
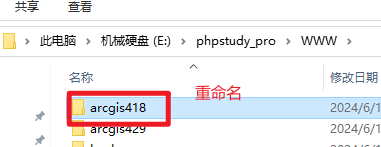
放到web服务器根目录下 并改名:
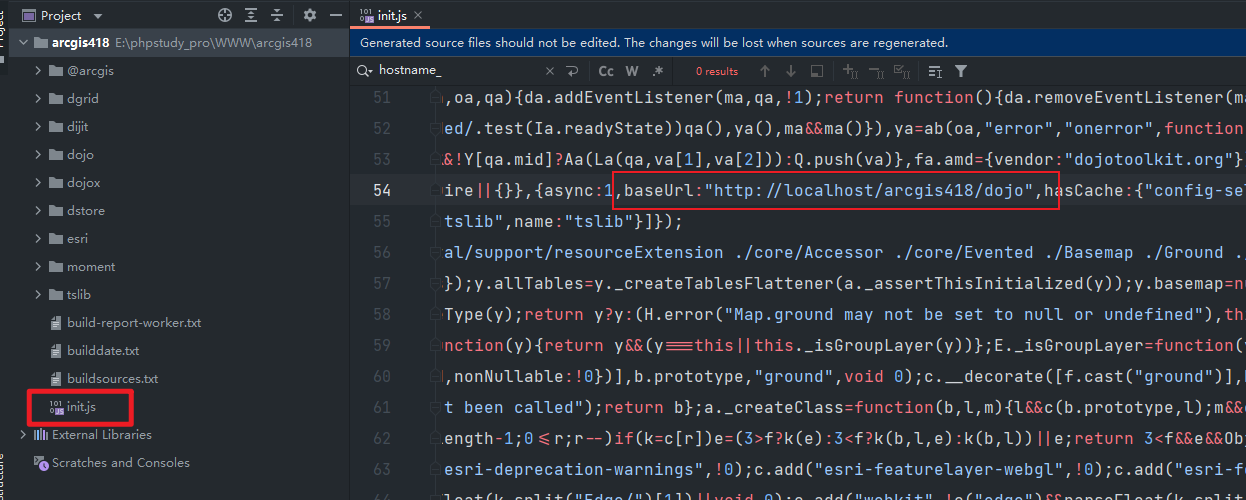
修改init.js:
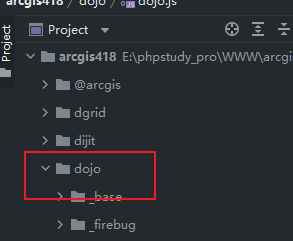
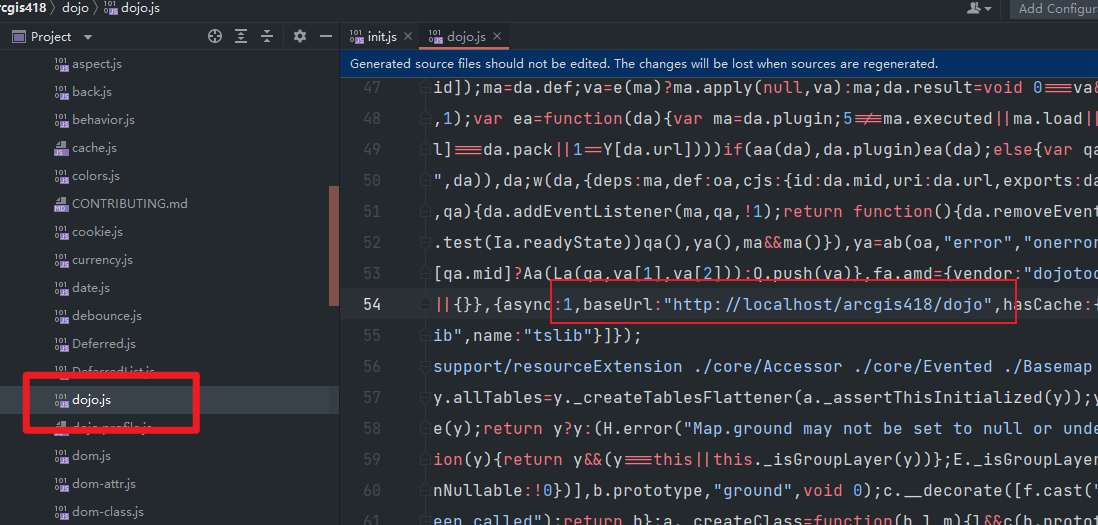
修改dojo.js
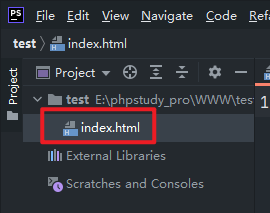
如何测试引用?
在另外一个项目中:
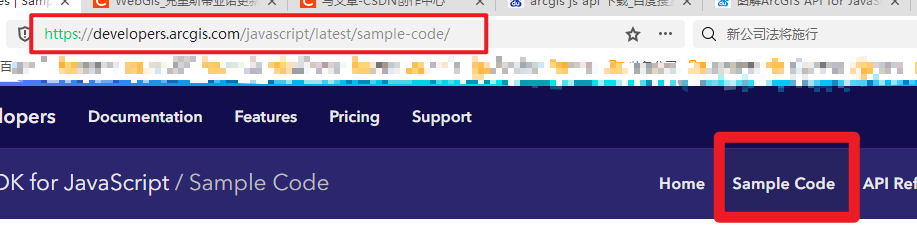
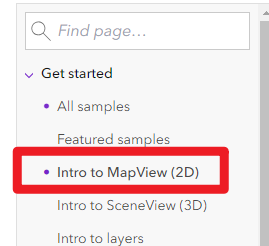
找一个案例代码:
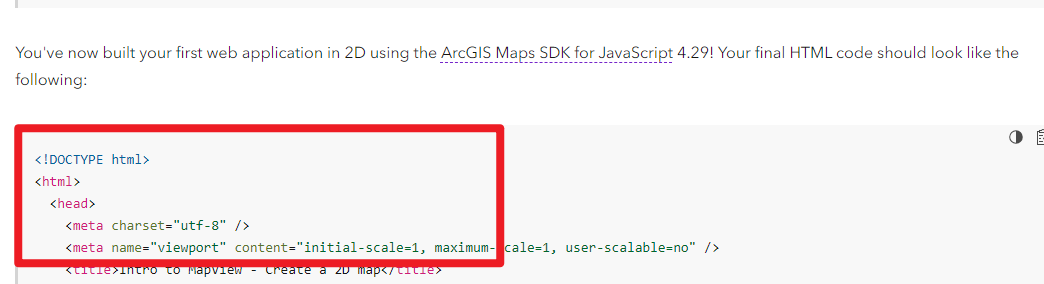
最下面一处的代码:
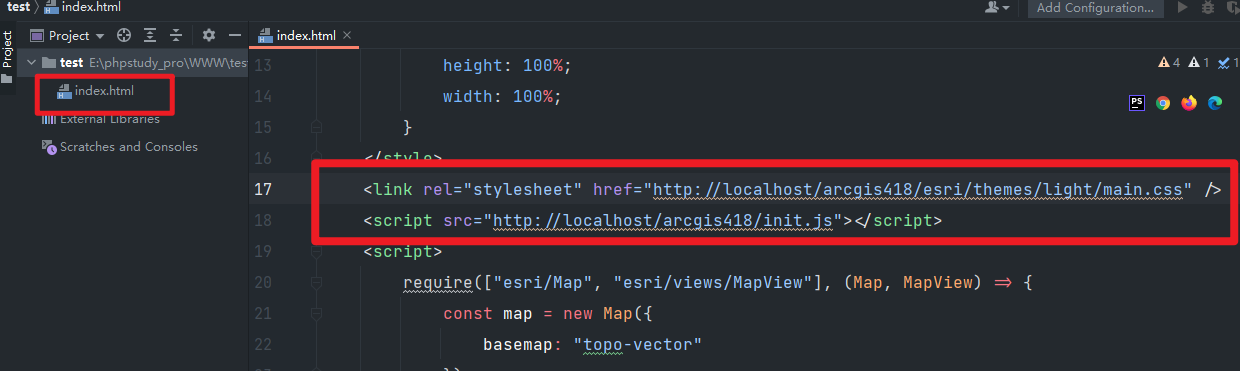
拷贝进入后修改这两处:
<!DOCTYPE html>
<html>
<head>
    <meta charset="utf-8" />
    <meta name="viewport" content="initial-scale=1, maximum-scale=1, user-scalable=no" />
    <title>Intro to MapView - Create a 2D map</title>
    <style>
        html,
        body,
        #viewDiv {
            padding: 0;
            margin: 0;
            height: 100%;
            width: 100%;
        }
    </style>
    <link rel="stylesheet" href="http://localhost/arcgis418/esri/themes/light/main.css" />
    <script src="http://localhost/arcgis418/init.js"></script>
    <script>
        require(["esri/Map", "esri/views/MapView"], (Map, MapView) => {
            const map = new Map({
                basemap: "topo-vector"
            });
            const view = new MapView({
                container: "viewDiv", // Reference to the view div created in step 5
                map: map, // Reference to the map object created before the view
                zoom: 4, // Sets zoom level based on level of detail (LOD)
                center: [15, 65] // Sets center point of view using longitude,latitude
            });
        });
    </script>
</head>
<body>
<div id="viewDiv"></div>
</body>
</html>
访问地址:
成功!
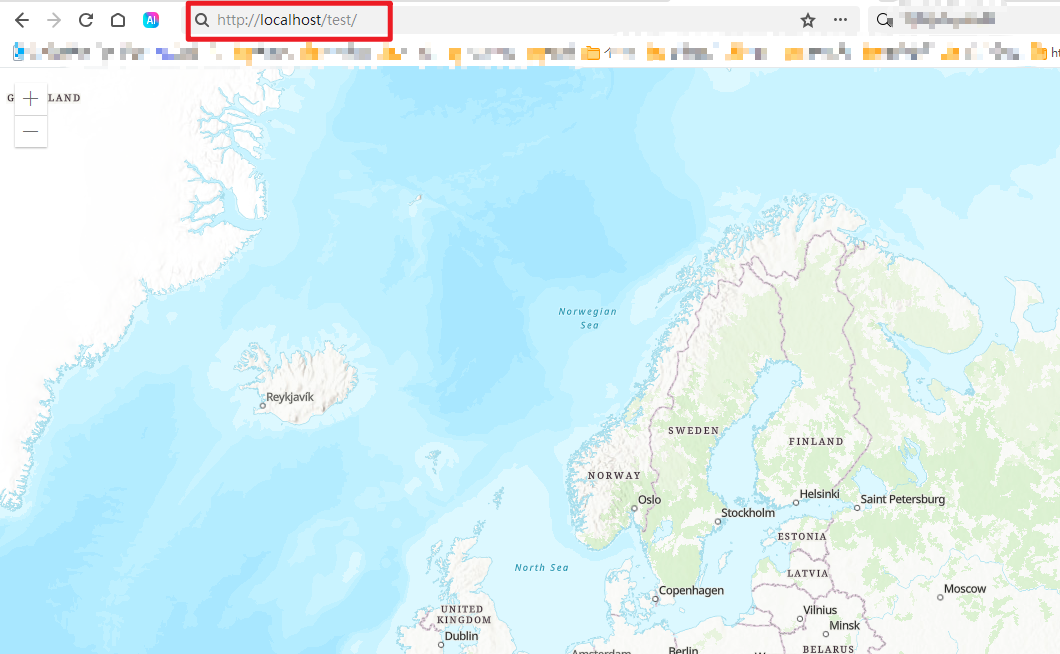
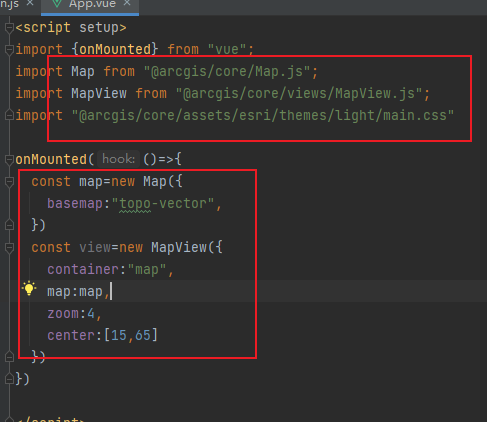
如果是vue3引入该怎么写?
应用程序.vue
<script setup>
import {onMounted} from "vue";
import Map from "@arcgis/core/Map.js";
import MapView from "@arcgis/core/views/MapView.js";
import "@arcgis/core/assets/esri/themes/light/main.css"

onMounted(()=>{
  const map=new Map({
    basemap:"topo-vector",
  })
  const view=new MapView({
    container:"map",
    map:map,
    zoom:4,
    center:[15,65]
  })
})

</script>

<template>
<div id="map"></div>
</template>

<style scoped>
html,
body,
#app,
#map{
  height: 500px;
  width: 100%;
  margin:0;
  padding:0;
}
</style>
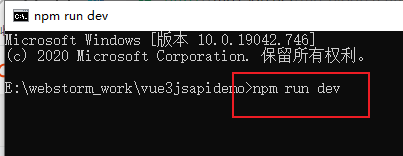
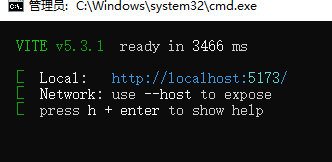
如何访问vue3项目:
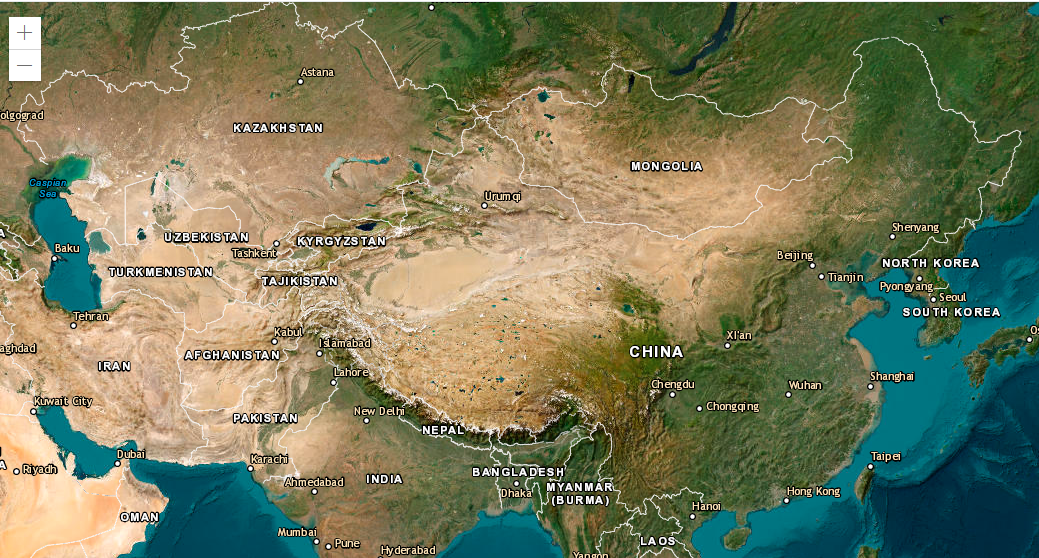
实例化二维地图:
<!DOCTYPE html>
<html>
<head>
    <meta charset="utf-8" />
    <meta name="viewport" content="initial-scale=1, maximum-scale=1, user-scalable=no" />
    <title>Intro to MapView - Create a 2D map</title>
    <style>
        html,
        body,
        #viewDiv {
            padding: 0;
            margin: 0;
            height: 100%;
            width: 100%;
        }
    </style>
    <link rel="stylesheet" href="http://localhost/arcgis418/esri/themes/light/main.css" />
    <script src="http://localhost/arcgis418/init.js"></script>
    <script>
        require(["esri/Map", "esri/views/MapView"], (Map, MapView) => {
            const map = new Map({
                basemap: "hybrid"
            });
            const view = new MapView({
                container: "viewDiv", // Reference to the view div created in step 5
                map: map, // Reference to the map object created before the view
                zoom: 4, // Sets zoom level based on level of detail (LOD)
                center: [104.48060937499996, 36.30556423523153] // Sets center point of view using longitude,latitude
            });
        });
    </script>
</head>
<body>
<div id="viewDiv"></div>
</body>
</html>
实例化三维地图:
<!DOCTYPE html>
<html>
<head>
    <meta charset="utf-8" />
    <meta name="viewport" content="initial-scale=1, maximum-scale=1, user-scalable=no" />
    <title>Intro to SceneView - Create a 3D map</title>
    <style>
        html,
        body,
        #viewDiv {
            padding: 0;
            margin: 0;
            height: 100%;
            width: 100%;
        }
    </style>
    <link rel="stylesheet" href="http://localhost/arcgis418/esri/themes/light/main.css" />
    <script src="http://localhost/arcgis418/init.js"></script>
    <script>
        require(["esri/Map", "esri/views/SceneView"], (Map, SceneView) => {
            const map = new Map({
                basemap: "hybrid"
            });
            const view = new SceneView({
                container: "viewDiv", // Reference to the view div
                map: map, // Reference to the map object created before the view
                zoom: 4, // Sets zoom level based on level of detail (LOD)
                center: [104.48060937499996, 36.30556423523153] // Sets center point of view using longitude, latitude
            });
        });
    </script>
</head>
<body>
<div id="viewDiv"></div>
</body>
</html>

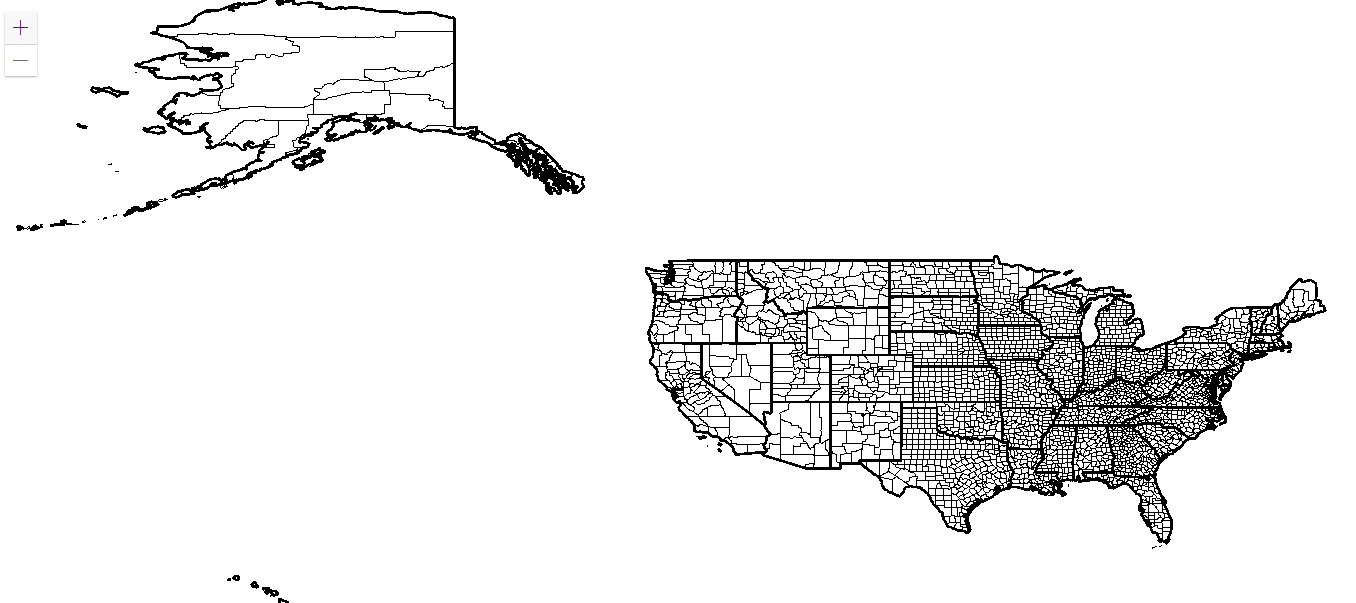
自定义底图:(仅仅底图)----这里特别注意:引入自定义底图就要使用到之前 Arcgis导出的服务地址。
<!DOCTYPE html>
<html>
<head>
    <meta charset="utf-8" />
    <meta name="viewport" content="initial-scale=1, maximum-scale=1, user-scalable=no" />
    <title>003自定义底图</title>
    <style>
        html,
        body,
        #viewDiv {
            padding: 0;
            margin: 0;
            height: 100%;
            width: 100%;
        }
    </style>
    <link rel="stylesheet" href="http://localhost/arcgis418/esri/themes/light/main.css" />
    <script src="http://localhost/arcgis418/init.js"></script>
    <script>
        require([
            "esri/Map",
            "esri/views/MapView",
            "esri/Basemap",
            "esri/layers/MapImageLayer"
        ], (Map, MapView, Basemap, MapImageLayer) => {
            // Define the custom MapImageLayer
            const mapImageLayer = new MapImageLayer({
                url: "https://sampleserver6.arcgisonline.com/arcgis/rest/services/Census/MapServer"
            });

            // Define the custom Basemap
            const customBasemap = new Basemap({
                baseLayers: [mapImageLayer],
                title: "Custom Basemap",
                id: "customBasemap"
            });

            // Create the Map with the custom Basemap
            const map = new Map({
                basemap: customBasemap
            });

            // Create the MapView
            const view = new MapView({
                container: "viewDiv", // Reference to the view div
                map: map, // Reference to the map object created before the view
                zoom: 4, // Sets zoom level based on level of detail (LOD)
                center: [-98.35, 39.50] // Sets center point of view using longitude, latitude
            });
        });
    </script>
</head>
<body>
<div id="viewDiv"></div>
</body>
</html>
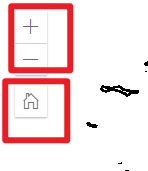
地图控件:
<!DOCTYPE html>
<html>
<head>
    <meta charset="utf-8" />
    <meta name="viewport" content="initial-scale=1, maximum-scale=1, user-scalable=no" />
    <title>004地图控件</title>
    <style>
        html,
        body,
        #viewDiv {
            padding: 0;
            margin: 0;
            height: 100%;
            width: 100%;
        }
    </style>
    <link rel="stylesheet" href="http://localhost/arcgis418/esri/themes/light/main.css" />
    <script src="http://localhost/arcgis418/init.js"></script>
    <script>
        require([
            "esri/Map",
            "esri/views/MapView",
            "esri/Basemap",
            "esri/layers/MapImageLayer",
            "esri/widgets/Home",
            "esri/widgets/ScaleBar",
            "esri/widgets/Legend"
        ], (Map, MapView, Basemap, MapImageLayer, Home, ScaleBar, Legend) => {
            // Define the custom MapImageLayer
            const mapImageLayer = new MapImageLayer({
                url: "https://sampleserver6.arcgisonline.com/arcgis/rest/services/Census/MapServer"
            });

            // Define the custom Basemap
            const customBasemap = new Basemap({
                baseLayers: [mapImageLayer],
                title: "Custom Basemap",
                id: "customBasemap"
            });

            // Create the Map with the custom Basemap
            const map = new Map({
                basemap: customBasemap
            });

            // Create the MapView
            const view = new MapView({
                container: "viewDiv", // Reference to the view div
                map: map, // Reference to the map object created before the view
                zoom: 4, // Sets zoom level based on level of detail (LOD)
                center: [-98.35, 39.50] // Sets center point of view using longitude, latitude
            });

            // Add Home widget
            const homeWidget = new Home({
                view: view
            });
            view.ui.add(homeWidget, "top-left");

            // Add ScaleBar widget
            const scaleBar = new ScaleBar({
                view: view,
                unit: "dual" // The scale bar displays both metric and non-metric units.
            });
            view.ui.add(scaleBar, {
                position: "bottom-left"
            });

            // Add Legend widget
            const legend = new Legend({
                view: view
            });
            view.ui.add(legend, "bottom-right");
        });
    </script>
</head>
<body>
<div id="viewDiv"></div>
</body>
</html>
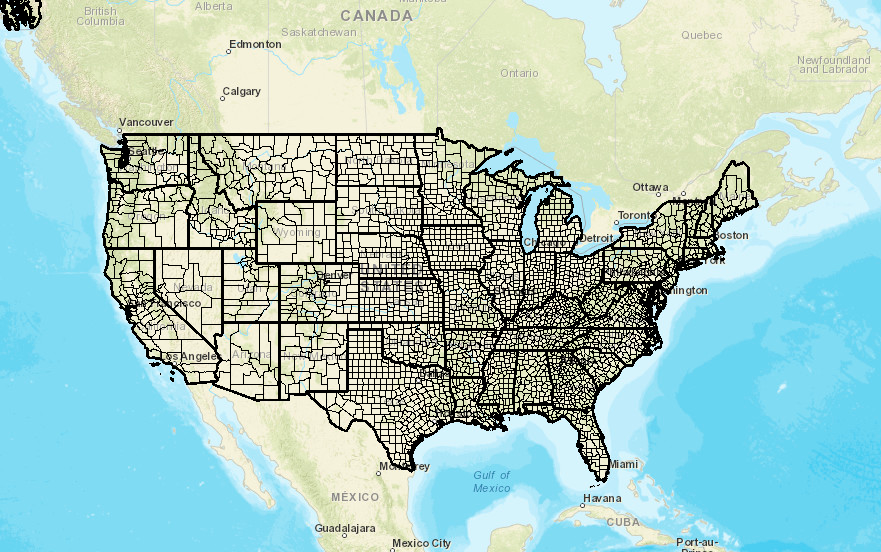
地图底图叠加:(底层+服务地址的图层)
<!DOCTYPE html> <html> <head> <meta charset="utf-8" /> <meta name="viewport" content="initial-scale=1, maximum-scale=1, user-scalable=no" /> <title>006自定义底图叠加底图</title> <style> html, body, #viewDiv { padding: 0; margin: 0; height: 100%; width: 100%; } </style> <link rel="stylesheet" href="http://localhost/arcgis418/esri/themes/light/main.css" /> <script src="http://localhost/arcgis418/init.js"></script> <script> require([ "esri/Map", "esri/views/MapView", "esri/layers/MapImageLayer", "esri/widgets/Home", ], (Map, MapView, MapImageLayer, Home, ScaleBar, Legend) => { // Define the custom MapImageLayer const mapImageLayer = new MapImageLayer({ url: "https://sampleserver6.arcgisonline.com/arcgis/rest/services/Census/MapServer" }); // Create the Map with a predefined basemap const map = new Map({ basemap: "streets" // You can choose any predefined basemap here }); // Add the custom MapImageLayer to the map map.add(mapImageLayer); // Create the MapView const view = new MapView({ container: "viewDiv", // Reference to the view div map: map, // Reference to the map object created before the view zoom: 4, // Sets zoom level based on level of detail (LOD) center: [-98.35, 39.50] // Sets center point of view using longitude, latitude }); // Add Home widget const homeWidget = new Home({ view: view }); view.ui.add(homeWidget, "top-left"); }); </script> </head> <body> <div id="viewDiv"></div> </body> </html>
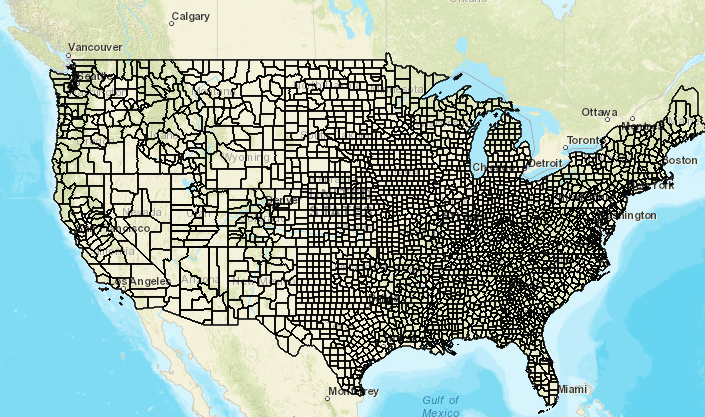
服务地址图层的理解:
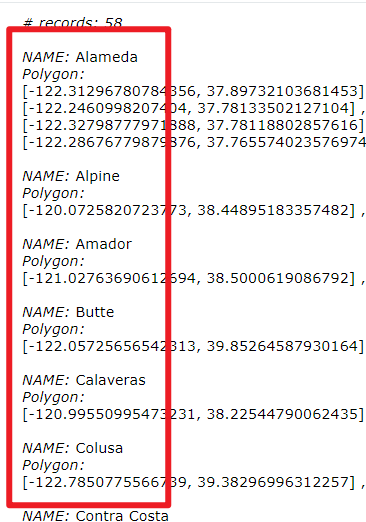
图层有三种,每种展示的不同。其中第(2)显示每个县。
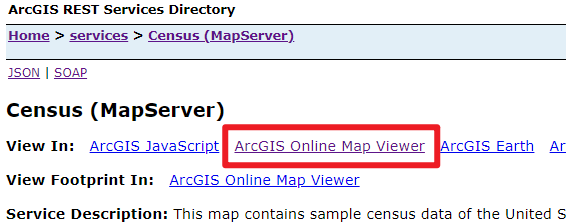
可查看ArcGis:
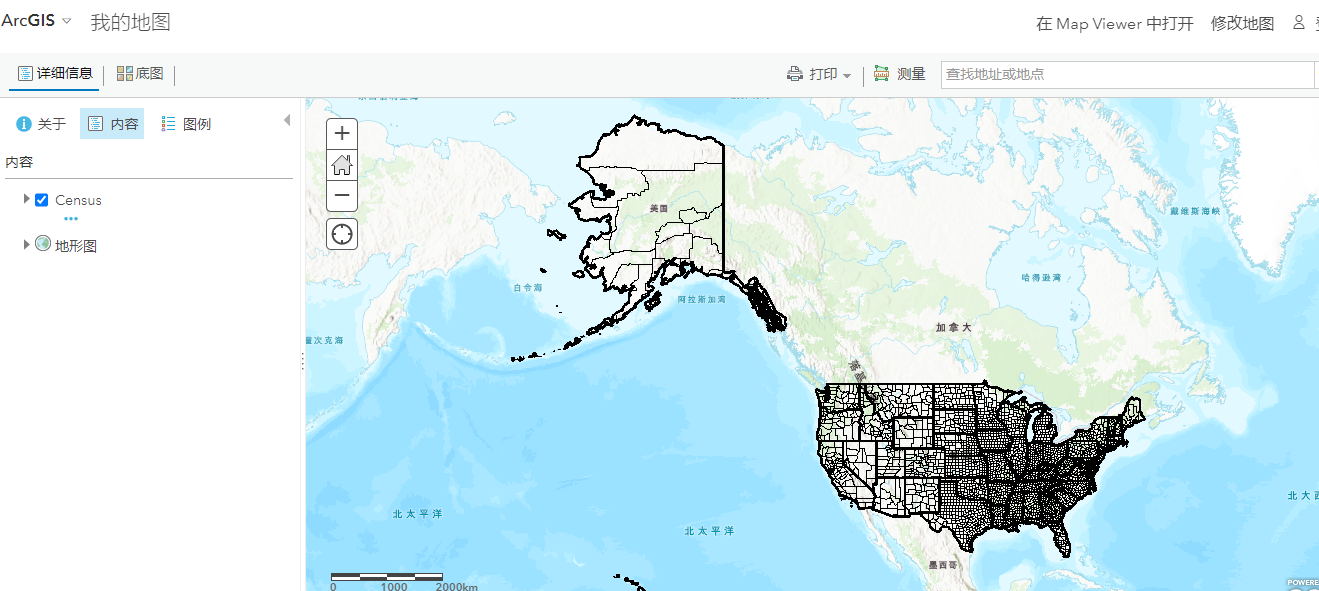
展示如下:
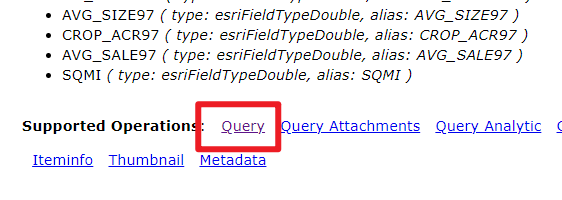
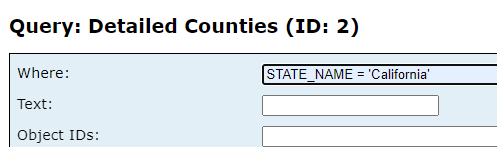
属性查询:进入(2)中
展示:
返回结果:展示洲下面的城市:
添加服务层:(这里特别注意:服务地址图层的理解)
<!DOCTYPE html>
<html>
<head>
    <meta charset="utf-8" />
    <meta name="viewport" content="initial-scale=1, maximum-scale=1, user-scalable=no" />
    <title>007添加服务图层2.html</title>
    <style>
        html,
        body,
        #viewDiv {
            padding: 0;
            margin: 0;
            height: 100%;
            width: 100%;
        }
    </style>
    <link rel="stylesheet" href="http://localhost/arcgis418/esri/themes/light/main.css" />
    <script src="http://localhost/arcgis418/init.js"></script>
    <script>
        require([
            "esri/Map",
            "esri/views/MapView",
            "esri/layers/MapImageLayer",
            "esri/widgets/Home",
            "esri/widgets/ScaleBar",
            "esri/widgets/Legend",
            "esri/layers/FeatureLayer"
        ], (Map, MapView, MapImageLayer, Home, ScaleBar, Legend, FeatureLayer) => {
            // Define the custom MapImageLayer
            // const mapImageLayer = new MapImageLayer({
            //     url: "https://sampleserver6.arcgisonline.com/arcgis/rest/services/Census/MapServer"
            // });

            // Define the specific FeatureLayer to add
            const featureLayer = new FeatureLayer({
                url: "https://sampleserver6.arcgisonline.com/arcgis/rest/services/Census/MapServer/2"
            });

            // Create the Map with a predefined basemap
            const map = new Map({
                basemap: "streets" // You can choose any predefined basemap here
            });

            // Add the custom MapImageLayer and FeatureLayer to the map
            // map.add(mapImageLayer);
            map.add(featureLayer);

            // Create the MapView
            const view = new MapView({
                container: "viewDiv", // Reference to the view div
                map: map, // Reference to the map object created before the view
                zoom: 4, // Sets zoom level based on level of detail (LOD)
                center: [-98.35, 39.50] // Sets center point of view using longitude, latitude
            });

            // Add Home widget
            const homeWidget = new Home({
                view: view
            });
            view.ui.add(homeWidget, "top-left");

            // Add ScaleBar widget
            const scaleBar = new ScaleBar({
                view: view,
                unit: "dual" // The scale bar displays both metric and non-metric units.
            });
            view.ui.add(scaleBar, {
                position: "bottom-left"
            });

            // Add Legend widget
            const legend = new Legend({
                view: view
            });
            view.ui.add(legend, "bottom-right");
        });
    </script>
</head>
<body>
<div id="viewDiv"></div>
</body>
</html>
MapImageLayer和 featureLayer的区别:
featureLayer用在分的部分。
如何添加服务层?
map.add(featureLayer);
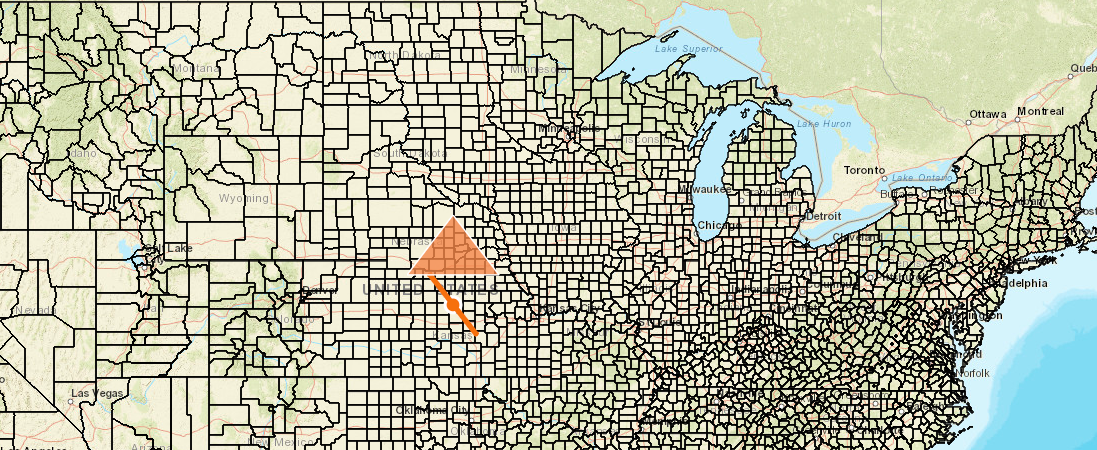
绘制点线面:
<!DOCTYPE html>
<html>
<head>
    <meta charset="utf-8" />
    <meta name="viewport" content="initial-scale=1, maximum-scale=1, user-scalable=no" />
    <title>008绘制点线面</title>
    <style>
        html,
        body,
        #viewDiv {
            padding: 0;
            margin: 0;
            height: 100%;
            width: 100%;
        }
    </style>
    <link rel="stylesheet" href="http://localhost/arcgis418/esri/themes/light/main.css" />
    <script src="http://localhost/arcgis418/init.js"></script>
    <script>
        require([
            "esri/Map",
            "esri/views/MapView",
            "esri/layers/FeatureLayer",
            "esri/Graphic",
            "esri/layers/GraphicsLayer",
            "esri/widgets/Home",
            "esri/widgets/ScaleBar",
            "esri/widgets/Legend"
        ], (Map, MapView, FeatureLayer, Graphic, GraphicsLayer, Home, ScaleBar, Legend) => {
            // Define the specific FeatureLayer to add
            const featureLayer = new FeatureLayer({
                url: "https://sampleserver6.arcgisonline.com/arcgis/rest/services/Census/MapServer/2"
            });

            // Create the Map with a predefined basemap
            const map = new Map({
                basemap: "streets" // You can choose any predefined basemap here
            });

            // Add the custom FeatureLayer to the map
            map.add(featureLayer);

            // Create the MapView
            const view = new MapView({
                container: "viewDiv", // Reference to the view div
                map: map, // Reference to the map object created before the view
                zoom: 4, // Sets zoom level based on level of detail (LOD)
                center: [-98.35, 39.50] // Sets center point of view using longitude, latitude
            });

            // Add Home widget
            const homeWidget = new Home({
                view: view
            });
            view.ui.add(homeWidget, "top-left");

            // Add ScaleBar widget
            const scaleBar = new ScaleBar({
                view: view,
                unit: "dual" // The scale bar displays both metric and non-metric units.
            });
            view.ui.add(scaleBar, {
                position: "bottom-left"
            });

            // Add Legend widget
            const legend = new Legend({
                view: view
            });
            view.ui.add(legend, "bottom-right");

            // Create a GraphicsLayer to hold the drawn graphics
            const graphicsLayer = new GraphicsLayer();
            map.add(graphicsLayer);

            // Create a point graphic
            const point = {
                type: "point",
                longitude: -98.35,
                latitude: 39.50
            };

            const pointSymbol = {
                type: "simple-marker",
                color: [226, 119, 40],
                outline: {
                    color: [255, 255, 255],
                    width: 2
                }
            };

            const pointGraphic = new Graphic({
                geometry: point,
                symbol: pointSymbol
            });

            // Create a line graphic
            const polyline = {
                type: "polyline",
                paths: [
                    [-99.35, 40.50],
                    [-97.35, 38.50]
                ]
            };

            const lineSymbol = {
                type: "simple-line",
                color: [226, 119, 40],
                width: 4
            };

            const polylineGraphic = new Graphic({
                geometry: polyline,
                symbol: lineSymbol
            });

            // Create a polygon graphic
            const polygon = {
                type: "polygon",
                rings: [
                    [-100.35, 40.50],
                    [-98.35, 42.50],
                    [-96.35, 40.50],
                    [-100.35, 40.50]
                ]
            };

            const polygonSymbol = {
                type: "simple-fill",
                color: [227, 139, 79, 0.8],
                outline: {
                    color: [255, 255, 255],
                    width: 1
                }
            };

            const polygonGraphic = new Graphic({
                geometry: polygon,
                symbol: polygonSymbol
            });

            // Add the graphics to the graphics layer
            graphicsLayer.add(pointGraphic);
            graphicsLayer.add(polylineGraphic);
            graphicsLayer.add(polygonGraphic);
        });
    </script>
</head>
<body>
<div id="viewDiv"></div>
</body>
</html>
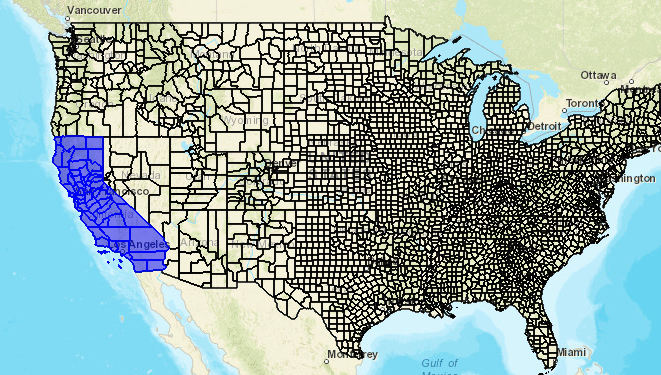
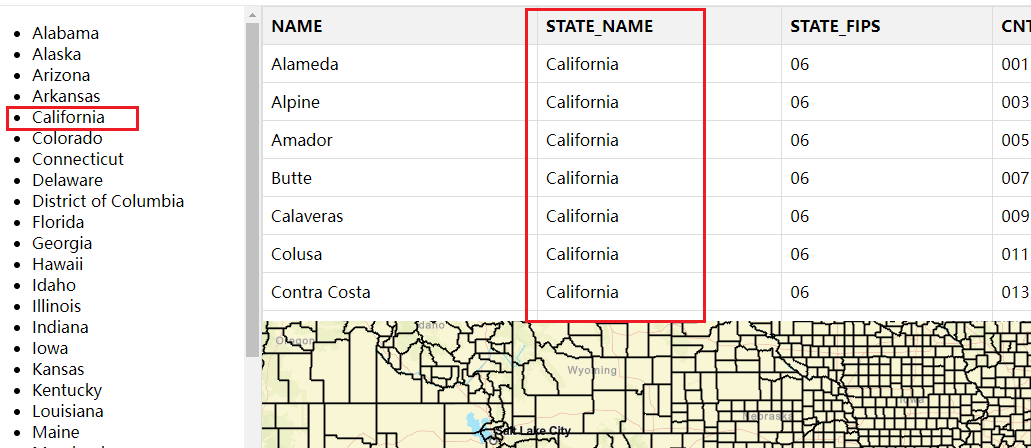
属性查询:
<!DOCTYPE html>
<html>
<head>
    <meta charset="utf-8" />
    <meta name="viewport" content="initial-scale=1, maximum-scale=1, user-scalable=no" />
    <title>009属性查询</title>
    <style>
        html,
        body,
        #viewDiv {
            padding: 0;
            margin: 0;
            height: 100%;
            width: 100%;
        }
    </style>
    <link rel="stylesheet" href="http://localhost/arcgis418/esri/themes/light/main.css" />
    <script src="http://localhost/arcgis418/init.js"></script>
    <script>
        require([
            "esri/Map",
            "esri/views/MapView",
            "esri/layers/FeatureLayer",
            "esri/Graphic",
            "esri/layers/GraphicsLayer",
            "esri/widgets/Home",
            "esri/widgets/ScaleBar",
            "esri/widgets/Legend",
            "esri/tasks/QueryTask",
            "esri/tasks/support/Query"
        ], (Map, MapView, FeatureLayer, Graphic, GraphicsLayer, Home, ScaleBar, Legend, QueryTask, Query) => {
            // Define the specific FeatureLayer to add
            const featureLayer = new FeatureLayer({
                url: "https://sampleserver6.arcgisonline.com/arcgis/rest/services/Census/MapServer/2"
            });

            // Create the Map with a predefined basemap
            const map = new Map({
                basemap: "streets" // You can choose any predefined basemap here
            });

            // Add the custom FeatureLayer to the map
            map.add(featureLayer);

            // Create the MapView
            const view = new MapView({
                container: "viewDiv", // Reference to the view div
                map: map, // Reference to the map object created before the view
                zoom: 4, // Sets zoom level based on level of detail (LOD)
                center: [-98.35, 39.50] // Sets center point of view using longitude, latitude
            });

            // Add Home widget
            const homeWidget = new Home({
                view: view
            });
            view.ui.add(homeWidget, "top-left");

            // Add ScaleBar widget
            const scaleBar = new ScaleBar({
                view: view,
                unit: "dual" // The scale bar displays both metric and non-metric units.
            });
            view.ui.add(scaleBar, {
                position: "bottom-left"
            });

            // Add Legend widget
            const legend = new Legend({
                view: view
            });
            view.ui.add(legend, "bottom-right");

            // Create a GraphicsLayer to hold the query results
            const graphicsLayer = new GraphicsLayer();
            map.add(graphicsLayer);

            // Create a QueryTask
            const queryTask = new QueryTask({
                url: "https://sampleserver6.arcgisonline.com/arcgis/rest/services/Census/MapServer/2"
            });

            // Create a Query
            const query = new Query();
            query.where = "STATE_NAME = 'California'"; // Replace with your attribute query condition
            query.returnGeometry = true;
            query.outFields = ["*"];

            // Execute the query
            queryTask.execute(query).then((results) => {
                // Loop through results and add each feature to the graphics layer
                results.features.forEach((feature) => {
                    const graphic = new Graphic({
                        geometry: feature.geometry,
                        symbol: {
                            type: "simple-fill", // autocasts as new SimpleFillSymbol()
                            color: [0, 0, 255, 0.5],
                            outline: {
                                color: [0, 0, 255],
                                width: 1
                            }
                        },
                        attributes: feature.attributes,
                        popupTemplate: {
                            title: "{NAME}",
                            content: "Population: {POP2000}"
                        }
                    });
                    graphicsLayer.add(graphic);
                });

                // Zoom to the extent of the query results
                if (results.features.length > 0) {
                    view.goTo(results.features);
                }
            }).catch((error) => {
                console.error("Query failed: ", error);
            });

        });
    </script>
</head>
<body>
<div id="viewDiv"></div>
</body>
</html>
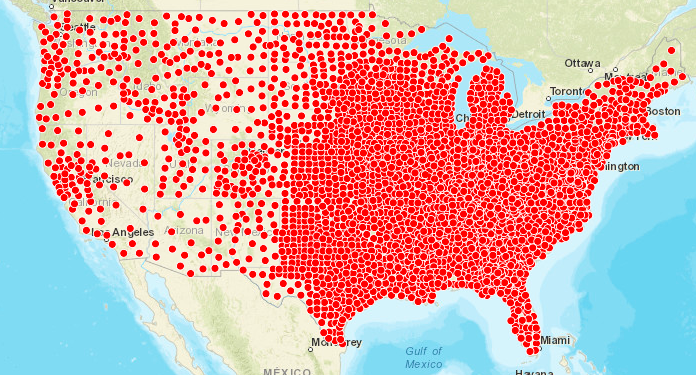
reanderer渲染:
<!DOCTYPE html>
<html>
<head>
    <meta charset="utf-8" />
    <meta name="viewport" content="initial-scale=1, maximum-scale=1, user-scalable=no" />
    <title>010render渲染.html</title>
    <style>
        html,
        body,
        #viewDiv {
            padding: 0;
            margin: 0;
            height: 100%;
            width: 100%;
        }
    </style>
    <link rel="stylesheet" href="http://localhost/arcgis418/esri/themes/light/main.css" />
    <script src="http://localhost/arcgis418/init.js"></script>
    <script>
        require([
            "esri/Map",
            "esri/views/MapView",
            "esri/layers/MapImageLayer",
            "esri/widgets/Home",
            "esri/widgets/ScaleBar",
            "esri/widgets/Legend",
            "esri/layers/FeatureLayer"
        ], (Map, MapView, MapImageLayer, Home, ScaleBar, Legend, FeatureLayer) => {


            // Define the specific FeatureLayer to add
            const featureLayer = new FeatureLayer({
                url: "https://sampleserver6.arcgisonline.com/arcgis/rest/services/Census/MapServer/2"
            });

            featureLayer.renderer={
                type:'simple',
                symbol:{
                    type:"simple-marker",
                    size:6,
                    color:"red",
                    outline:{
                        width:0.5,
                        color:"white"
                    }
                }
            }

            // Create the Map with a predefined basemap
            const map = new Map({
                basemap: "streets" // You can choose any predefined basemap here
            });


            map.add(featureLayer);

            // Create the MapView
            const view = new MapView({
                container: "viewDiv", // Reference to the view div
                map: map, // Reference to the map object created before the view
                zoom: 4, // Sets zoom level based on level of detail (LOD)
                center: [-98.35, 39.50] // Sets center point of view using longitude, latitude
            });


        });
    </script>
</head>
<body>
<div id="viewDiv"></div>
</body>
</html>
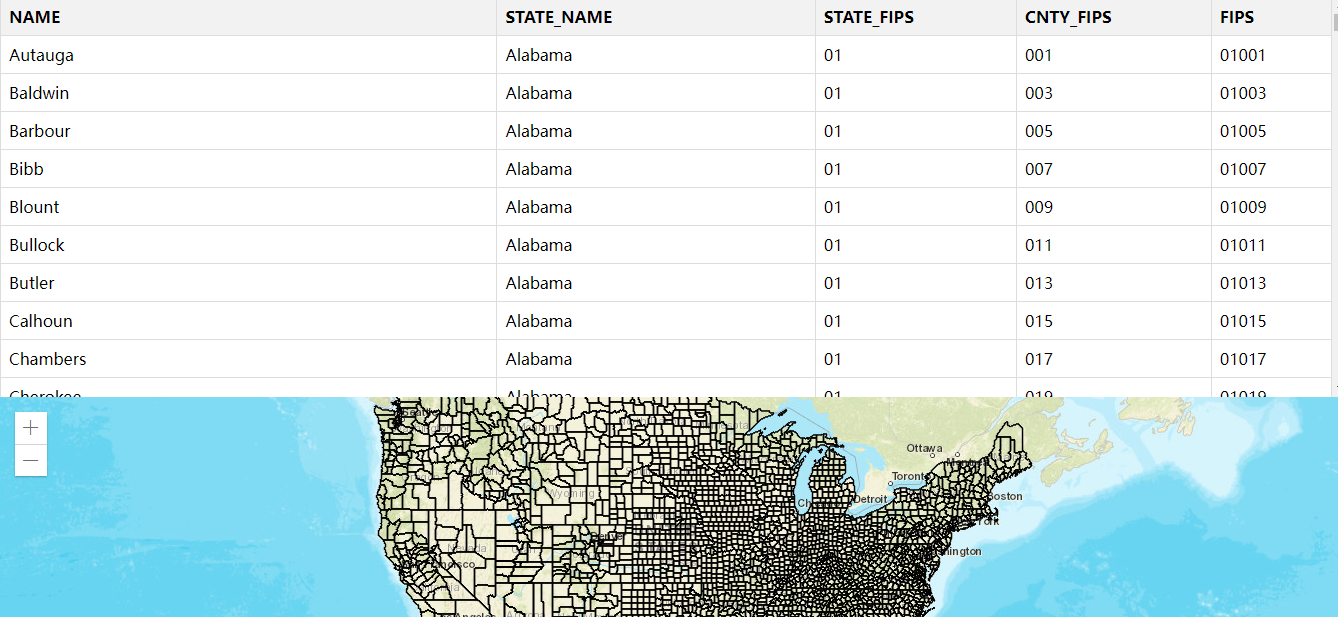
获取服务地址的字段,生成一个表格
<!DOCTYPE html>
<html>
<head>
    <meta charset="utf-8" />
    <meta name="viewport" content="initial-scale=1, maximum-scale=1, user-scalable=no" />
    <title>012服务地址字段渲染表格.html</title>
    <style>
        html, body, #viewDiv, #tableDiv {
            padding: 0;
            margin: 0;

            width: 100%;
        }
        #tableDiv {

            overflow: auto;
        }
        table {
            width: 100%;
            border-collapse: collapse;
        }
        th, td {
            padding: 8px;
            text-align: left;
            border: 1px solid #ddd;
        }
        th {
            background-color: #f2f2f2;
        }
    </style>
    <link rel="stylesheet" href="http://localhost/arcgis418/esri/themes/light/main.css" />
    <script src="http://localhost/arcgis418/init.js"></script>
    <script>
        require([
            "esri/Map",
            "esri/views/MapView",
            "esri/layers/MapImageLayer",
            "esri/widgets/Home",
            "esri/widgets/ScaleBar",
            "esri/widgets/Legend",
            "esri/layers/FeatureLayer"
        ], (Map, MapView, MapImageLayer, Home, ScaleBar, Legend, FeatureLayer) => {

            // Define the specific FeatureLayer to add
            const featureLayer = new FeatureLayer({
                url: "https://sampleserver6.arcgisonline.com/arcgis/rest/services/Census/MapServer/2"
            });


            // Create the Map with a predefined basemap
            const map = new Map({
                basemap: "streets" // You can choose any predefined basemap here
            });

            map.add(featureLayer);

            // Create the MapView
            const view = new MapView({
                container: "viewDiv", // Reference to the view div
                map: map, // Reference to the map object created before the view
                zoom: 4, // Sets zoom level based on level of detail (LOD)
                center: [-98.35, 39.50] // Sets center point of view using longitude, latitude
            });

            // Function to create and populate table with feature data
            function populateTable(features) {
                const tableDiv = document.getElementById("tableDiv");

                // Create table
                const table = document.createElement("table");

                // Create header row
                const headerRow = document.createElement("tr");
                const headers = ["NAME", "STATE_NAME", "STATE_FIPS", "CNTY_FIPS", "FIPS"];
                headers.forEach(headerText => {
                    const th = document.createElement("th");
                    th.textContent = headerText;
                    headerRow.appendChild(th);
                });
                table.appendChild(headerRow);

                // Populate table with feature data
                features.forEach(feature => {
                    const row = document.createElement("tr");
                    headers.forEach(field => {
                        const td = document.createElement("td");
                        td.textContent = feature.attributes[field];
                        row.appendChild(td);
                    });
                    table.appendChild(row);
                });

                // Append table to div
                tableDiv.appendChild(table);
            }

            // Function to query all features
            function queryAllFeatures(layer, query) {
                let allFeatures = [];

                function executeQuery(offset) {
                    query.start = offset;
                    return layer.queryFeatures(query).then(result => {
                        allFeatures = allFeatures.concat(result.features);
                        if (result.exceededTransferLimit) {
                            // If more features to fetch, continue with next offset
                            return executeQuery(offset + query.num);
                        } else {
                            return allFeatures;
                        }
                    });
                }

                return executeQuery(0);
            }

            // Query the FeatureLayer for the specified fields
            view.when(() => {
                const query = featureLayer.createQuery();
                query.outFields = ["NAME", "STATE_NAME", "STATE_FIPS", "CNTY_FIPS", "FIPS"];
                query.returnGeometry = false;
                query.num = 1000; // Number of features to fetch per request

                queryAllFeatures(featureLayer, query).then(allFeatures => {
                    populateTable(allFeatures);
                }).catch(error => {
                    console.error("Error querying features: ", error);
                });
            });
        });
    </script>
</head>
<body>
<div id="tableDiv" style="height: 400px"></div>
<div id="viewDiv"  style="height: 300px"></div>

</body>
</html>
以上的代码转vue3
<template>
  <div>
    <div id="tableDiv" style="height: 400px;"></div>
    <div id="viewDiv" style="height: 300px;"></div>
  </div>
</template>

<script>
import { defineComponent, onMounted } from 'vue';
import Map from "@arcgis/core/Map";
import MapView from "@arcgis/core/views/MapView";
import FeatureLayer from "@arcgis/core/layers/FeatureLayer";

export default defineComponent({
  name: "App",
  setup() {
    onMounted(() => {
      // Define the specific FeatureLayer to add
      const featureLayer = new FeatureLayer({
        url: "https://sampleserver6.arcgisonline.com/arcgis/rest/services/Census/MapServer/2"
      });

      // Create the Map with a predefined basemap
      const map = new Map({
        basemap: "streets" // You can choose any predefined basemap here
      });

      map.add(featureLayer);

      // Create the MapView
      const view = new MapView({
        container: "viewDiv", // Reference to the view div
        map: map, // Reference to the map object created before the view
        zoom: 4, // Sets zoom level based on level of detail (LOD)
        center: [-98.35, 39.50] // Sets center point of view using longitude, latitude
      });

      // Function to create and populate table with feature data
      function populateTable(features) {
        const tableDiv = document.getElementById("tableDiv");

        // Create table
        const table = document.createElement("table");

        // Create header row
        const headerRow = document.createElement("tr");
        const headers = ["NAME", "STATE_NAME", "STATE_FIPS", "CNTY_FIPS", "FIPS"];
        headers.forEach(headerText => {
          const th = document.createElement("th");
          th.textContent = headerText;
          headerRow.appendChild(th);
        });
        table.appendChild(headerRow);

        // Populate table with feature data
        features.forEach(feature => {
          const row = document.createElement("tr");
          headers.forEach(field => {
            const td = document.createElement("td");
            td.textContent = feature.attributes[field];
            row.appendChild(td);
          });
          table.appendChild(row);
        });

        // Append table to div
        tableDiv.appendChild(table);
      }

      // Function to query all features
      function queryAllFeatures(layer, query) {
        let allFeatures = [];

        function executeQuery(offset) {
          query.start = offset;
          return layer.queryFeatures(query).then(result => {
            allFeatures = allFeatures.concat(result.features);
            if (result.exceededTransferLimit) {
              // If more features to fetch, continue with next offset
              return executeQuery(offset + query.num);
            } else {
              return allFeatures;
            }
          });
        }

        return executeQuery(0);
      }

      // Query the FeatureLayer for the specified fields
      view.when(() => {
        const query = featureLayer.createQuery();
        query.outFields = ["NAME", "STATE_NAME", "STATE_FIPS", "CNTY_FIPS", "FIPS"];
        query.returnGeometry = false;
        query.num = 1000; // Number of features to fetch per request

        queryAllFeatures(featureLayer, query).then(allFeatures => {
          populateTable(allFeatures);
        }).catch(error => {
          console.error("Error querying features: ", error);
        });
      });
    });
  }
});
</script>

<style>
html, body, #viewDiv, #tableDiv {
  padding: 0;
  margin: 0;
  width: 100%;
}
#tableDiv {
  overflow: auto;
}
table {
  width: 100%;
  border-collapse: collapse;
}
th, td {
  padding: 8px;
  text-align: left;
  border: 1px solid #ddd;
}
th {
  background-color: #f2f2f2;
}
</style>
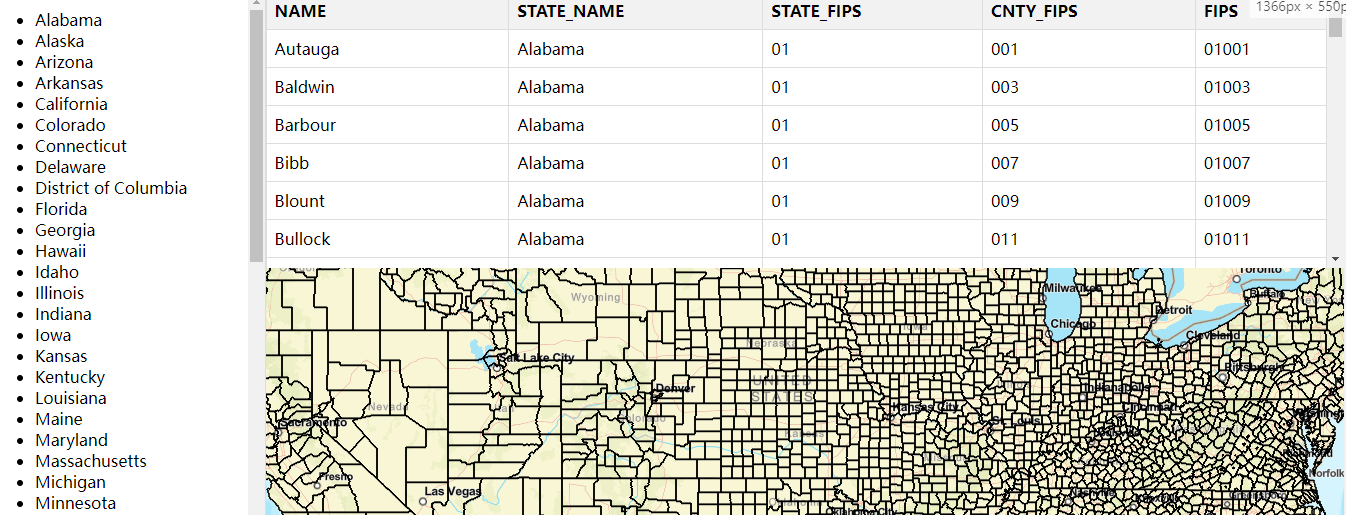
ArcGis 左侧 省份+ 右侧 表格 和 底图:(默认的表格是第一个省份)
<template>
  <div style="display: flex; height: 100vh;">
    <!-- Left side for STATE_NAME list -->
    <div id="stateList" style="width: 20%; overflow-y: auto; border-right: 1px solid #ddd;">
      <ul>
        <li v-for="state in stateNames" :key="state" @click="filterByState(state)">
          {{ state }}
        </li>
      </ul>
    </div>

    <!-- Right side for table and map -->
    <div style="width: 80%; display: flex; flex-direction: column;">
      <div id="tableDiv" style="height: 50%; overflow-y: auto;"></div>
      <div id="viewDiv" style="height: 50%;"></div>
    </div>
  </div>
</template>
<script>
import { defineComponent, onMounted ,ref} from 'vue';
import Map from "@arcgis/core/Map";
import MapView from "@arcgis/core/views/MapView";
import FeatureLayer from "@arcgis/core/layers/FeatureLayer";

export default defineComponent({
  name: "App",
  setup() {

    const stateNames = ref([]);
    const featuresByState = ref({});

    onMounted(() => {
      // Define the specific FeatureLayer to add
      const featureLayer = new FeatureLayer({
        url: "https://sampleserver6.arcgisonline.com/arcgis/rest/services/Census/MapServer/2"
      });

      // Create the Map with a predefined basemap
      const map = new Map({
        basemap: "streets" // You can choose any predefined basemap here
      });

      map.add(featureLayer);

      // Create the MapView
      const view = new MapView({
        container: "viewDiv", // Reference to the view div
        map: map, // Reference to the map object created before the view
        zoom: 4, // Sets zoom level based on level of detail (LOD)
        center: [-98.35, 39.50] // Sets center point of view using longitude, latitude
      });

      // Function to create and populate table with feature data
      function populateTable(features) {
        const tableDiv = document.getElementById("tableDiv");

        // Create table
        const table = document.createElement("table");

        // Create header row
        const headerRow = document.createElement("tr");
        const headers = ["NAME", "STATE_NAME", "STATE_FIPS", "CNTY_FIPS", "FIPS"];
        headers.forEach(headerText => {
          const th = document.createElement("th");
          th.textContent = headerText;
          headerRow.appendChild(th);
        });
        table.appendChild(headerRow);

        // Filter features to only include those with STATE_NAME = 'Alabama'
        const filteredFeatures = features.filter(feature => feature.attributes["STATE_NAME"] === 'Alabama');

        // Populate table with filtered feature data
        filteredFeatures.forEach(feature => {
          const row = document.createElement("tr");
          headers.forEach(field => {
            const td = document.createElement("td");
            td.textContent = feature.attributes[field];
            row.appendChild(td);
          });
          table.appendChild(row);
        });

        // Append table to div
        tableDiv.appendChild(table);
      }


      // Function to query all features
      function queryAllFeatures(layer, query) {
        let allFeatures = [];

        function executeQuery(offset) {
          query.start = offset;
          return layer.queryFeatures(query).then(result => {
            allFeatures = allFeatures.concat(result.features);
            if (result.exceededTransferLimit) {
              // If more features to fetch, continue with next offset
              return executeQuery(offset + query.num);
            } else {
              return allFeatures;
            }
          });
        }

        return executeQuery(0);
      }

      // Query the FeatureLayer for the specified fields
      view.when(() => {
        const query = featureLayer.createQuery();
        query.outFields = ["NAME", "STATE_NAME", "STATE_FIPS", "CNTY_FIPS", "FIPS"];
        query.returnGeometry = false;
        query.num = 1000; // Number of features to fetch per request

        queryAllFeatures(featureLayer, query).then(allFeatures => {
          populateTable(allFeatures);


          // 左侧数据
          const stateSet = new Set();
          allFeatures.forEach(feature => {
            const state = feature.attributes.STATE_NAME;
            if (!featuresByState.value[state]) {
              featuresByState.value[state] = [];
            }
            featuresByState.value[state].push(feature);
            stateSet.add(state);
          });
          stateNames.value = Array.from(stateSet).sort();


        }).catch(error => {
          console.error("Error querying features: ", error);
        });


      });
    });

    return {
      stateNames,

    };

  }
});
</script>

<style>
html, body, #viewDiv, #tableDiv {
  padding: 0;
  margin: 0;
  width: 100%;
}
#tableDiv {
  overflow: auto;
}
table {
  width: 100%;
  border-collapse: collapse;
}
th, td {
  padding: 8px;
  text-align: left;
  border: 1px solid #ddd;
}
th {
  background-color: #f2f2f2;
}
</style>
点击左侧菜单更新右侧表格:
<template>
  <div style="display: flex; height: 100vh;">
    <!-- 左侧显示 STATE_NAME 列表 -->
    <div id="stateList" style="width: 20%; overflow-y: auto; border-right: 1px solid #ddd;">
      <ul>
        <li v-for="state in stateNames" :key="state" @click="filterByState(state)" style="cursor: pointer">
          {{ state }}
        </li>
      </ul>
    </div>

    <!-- 右侧显示表格和地图 -->
    <div style="width: 80%; display: flex; flex-direction: column;">
      <div id="tableDiv" style="height: 50%; overflow-y: auto;"></div>
      <div id="viewDiv" style="height: 50%;"></div>
    </div>
  </div>
</template>

<script>
import { defineComponent, onMounted, ref } from 'vue';
import Map from "@arcgis/core/Map";
import MapView from "@arcgis/core/views/MapView";
import FeatureLayer from "@arcgis/core/layers/FeatureLayer";

export default defineComponent({
  name: "App",
  setup() {
    const stateNames = ref([]);
    const featuresByState = ref({});
    const allFeatures = ref([]);
    const featureLayerUrl = "https://sampleserver6.arcgisonline.com/arcgis/rest/services/Census/MapServer/2";

    // 创建并填充表格的函数
    function populateTable(features, state_name) {
      const tableDiv = document.getElementById("tableDiv");
      tableDiv.innerHTML = "";
      // Create table
      const table = document.createElement("table");

      // Create header row
      const headerRow = document.createElement("tr");
      const headers = ["NAME", "STATE_NAME", "STATE_FIPS", "CNTY_FIPS", "FIPS"];
      headers.forEach(headerText => {
        const th = document.createElement("th");
        th.textContent = headerText;
        headerRow.appendChild(th);
      });
      table.appendChild(headerRow);

      // Filter features to only include those with specified STATE_NAME
      if (!state_name) state_name = 'Alabama';
      console.log(state_name);
      const filteredFeatures = features.filter(feature => feature.attributes["STATE_NAME"] === state_name);

      // Populate table with filtered feature data
      filteredFeatures.forEach(feature => {
        const row = document.createElement("tr");
        headers.forEach(field => {
          const td = document.createElement("td");
          td.textContent = feature.attributes[field];
          row.appendChild(td);
        });
        table.appendChild(row);
      });

      // Append table to div
      tableDiv.appendChild(table);
    }

    onMounted(() => {
      // 创建地图并设置底图
      const map = new Map({
        basemap: "streets" // 可以选择任何预定义的底图
      });

      // 创建 MapView
      const view = new MapView({
        container: "viewDiv", // 引用 view div
        map: map, // 引用之前创建的地图对象
        zoom: 4, // 根据细节层次 (LOD) 设置缩放级别
        center: [-98.35, 39.50] // 使用经度、纬度设置视图中心点
      });

      // 定义要添加的特定 FeatureLayer
      const featureLayer = new FeatureLayer({
        url: featureLayerUrl
      });

      map.add(featureLayer);

      // 查询 FeatureLayer 中的指定字段
      view.when(() => {
        const query = createFeatureLayerQuery(featureLayer);

        queryAllFeatures(featureLayer, query).then(allFeaturesResult => {
          allFeatures.value = allFeaturesResult;
          populateTable(allFeaturesResult);

          // 左侧数据
          const stateSet = new Set();
          allFeaturesResult.forEach(feature => {
            const state = feature.attributes.STATE_NAME;
            if (!featuresByState.value[state]) {
              featuresByState.value[state] = [];
            }
            featuresByState.value[state].push(feature);
            stateSet.add(state);
          });
          stateNames.value = Array.from(stateSet).sort();
        }).catch(error => {
          console.error("查询特征时出错: ", error);
        });
      });
    });

    function filterByState(state) {
      const featureLayer = new FeatureLayer({
        url: featureLayerUrl
      });
      const query = createFeatureLayerQuery(featureLayer);

      queryAllFeatures(featureLayer, query).then(allFeaturesResult => {
        allFeatures.value = allFeaturesResult;
        populateTable(allFeaturesResult, state);
      }).catch(error => {
        console.error("查询特征时出错: ", error);
      });
    }

    // 创建 FeatureLayer 查询的函数
    function createFeatureLayerQuery(layer) {
      const query = layer.createQuery();
      query.outFields = ["NAME", "STATE_NAME", "STATE_FIPS", "CNTY_FIPS", "FIPS"];
      query.returnGeometry = false;
      query.num = 1000; // 每次请求获取的特征数量
      return query;
    }

    // 查询所有特征的函数
    function queryAllFeatures(layer, query) {
      let allFeaturesResult = [];

      function executeQuery(offset) {
        query.start = offset;
        return layer.queryFeatures(query).then(result => {
          allFeaturesResult = allFeaturesResult.concat(result.features);
          if (result.exceededTransferLimit) {
            // 如果还有更多特征需要获取,继续下一次偏移查询
            return executeQuery(offset + query.num);
          } else {
            return allFeaturesResult;
          }
        });
      }

      return executeQuery(0);
    }

    return {
      stateNames,
      filterByState
    };
  }
});
</script>

<style>
html, body, #viewDiv, #tableDiv {
  padding: 0;
  margin: 0;
  width: 100%;
}
#tableDiv {
  overflow: auto;
}
table {
  width: 100%;
  border-collapse: collapse;
}
th, td {
  padding: 8px;
  text-align: left;
  border: 1px solid #ddd;
}
th {
  background-color: #f2f2f2;
}
</style>
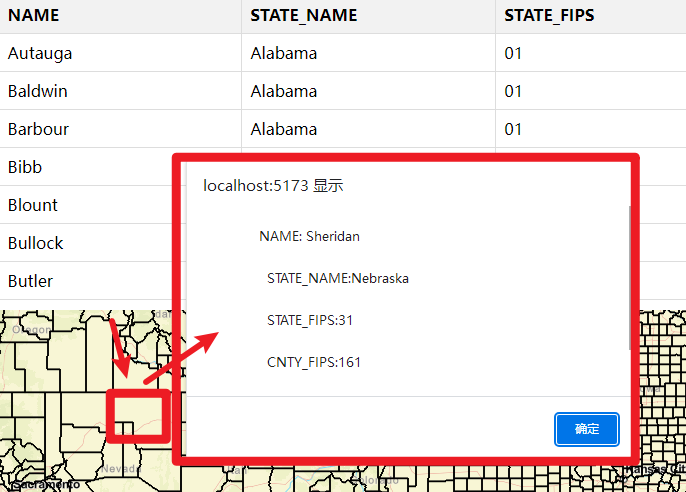
点击地图弹出 内容详情:
(题目: 地图交互
点击地块时,弹出弹框,展示地块的详细信息,弹框内容为地块详情的键值对列表。)
<template>
  <div style="display: flex; height: 100vh;">
    <!-- 左侧显示 STATE_NAME 列表 -->
    <div id="stateList" style="width: 20%; overflow-y: auto; border-right: 1px solid #ddd;">
      <ul>
        <li v-for="state in stateNames" :key="state" @click="filterByState(state)" style="cursor: pointer">
          {{ state }}
        </li>
      </ul>
    </div>

    <!-- 右侧显示表格和地图 -->
    <div style="width: 80%; display: flex; flex-direction: column;">
      <div id="tableDiv" style="height: 50%; overflow-y: auto;"></div>
      <div id="viewDiv" style="height: 50%;"></div>
    </div>
  </div>
</template>

<script>
import { defineComponent, onMounted, ref } from 'vue';
import Map from "@arcgis/core/Map";
import MapView from "@arcgis/core/views/MapView";
import FeatureLayer from "@arcgis/core/layers/FeatureLayer";

export default defineComponent({
  name: "App",
  setup() {
    const stateNames = ref([]);
    const featuresByState = ref({});
    const allFeatures = ref([]);
    const featureLayerUrl = "https://sampleserver6.arcgisonline.com/arcgis/rest/services/Census/MapServer/2";

    // 创建并填充表格的函数
    function populateTable(features, state_name) {
      const tableDiv = document.getElementById("tableDiv");
      tableDiv.innerHTML = "";
      // Create table
      const table = document.createElement("table");

      // Create header row
      const headerRow = document.createElement("tr");
      const headers = ["NAME", "STATE_NAME", "STATE_FIPS", "CNTY_FIPS", "FIPS"];
      headers.forEach(headerText => {
        const th = document.createElement("th");
        th.textContent = headerText;
        headerRow.appendChild(th);
      });
      table.appendChild(headerRow);

      // Filter features to only include those with specified STATE_NAME
      if (!state_name) state_name = 'Alabama';
      console.log(state_name);
      const filteredFeatures = features.filter(feature => feature.attributes["STATE_NAME"] === state_name);

      // Populate table with filtered feature data
      filteredFeatures.forEach(feature => {
        const row = document.createElement("tr");
        headers.forEach(field => {
          const td = document.createElement("td");
          td.textContent = feature.attributes[field];
          row.appendChild(td);
        });
        table.appendChild(row);
      });

      // Append table to div
      tableDiv.appendChild(table);
    }

    onMounted(() => {
      // 创建地图并设置底图
      const map = new Map({
        basemap: "streets" // 可以选择任何预定义的底图
      });

      // 创建 MapView
      const view = new MapView({
        container: "viewDiv", // 引用 view div
        map: map, // 引用之前创建的地图对象
        zoom: 4, // 根据细节层次 (LOD) 设置缩放级别
        center: [-98.35, 39.50] // 使用经度、纬度设置视图中心点
      });

      // 定义要添加的特定 FeatureLayer
      const featureLayer = new FeatureLayer({
        url: featureLayerUrl,
        outFields: ["NAME", "STATE_NAME", "STATE_FIPS", "CNTY_FIPS", "FIPS"],
        popupTemplate: {
          title: "{NAME}",
          content: [
            {
              type: "fields",
              fieldInfos: [
                { fieldName: "NAME", label: "Name" },
                { fieldName: "STATE_NAME", label: "State Name" },
                { fieldName: "STATE_FIPS", label: "State FIPS" },
                { fieldName: "CNTY_FIPS", label: "County FIPS" },
                { fieldName: "FIPS", label: "FIPS" }
              ]
            }
          ]
        }
      });

      map.add(featureLayer);

      // 查询 FeatureLayer 中的指定字段
      view.when(() => {
        const query = createFeatureLayerQuery(featureLayer);

        queryAllFeatures(featureLayer, query).then(allFeaturesResult => {
          allFeatures.value = allFeaturesResult;
          populateTable(allFeaturesResult);

          // 左侧数据
          const stateSet = new Set();
          allFeaturesResult.forEach(feature => {
            const state = feature.attributes.STATE_NAME;
            if (!featuresByState.value[state]) {
              featuresByState.value[state] = [];
            }
            featuresByState.value[state].push(feature);
            stateSet.add(state);
          });
          stateNames.value = Array.from(stateSet).sort();
        }).catch(error => {
          console.error("查询特征时出错: ", error);
        });
      });

      // 添加点击事件监听器
      view.on("click", (event) => {
        console.log("111")
        view.hitTest(event).then((response) => {

          const results = response.results;

          if (results.length > 0) {

            const filteredResults = results.filter(result => result.graphic.layer === featureLayer);
            if (filteredResults.length > 0) {
              const feature = filteredResults[0].graphic;

              let content= `
              NAME: ${feature.attributes.NAME} \n\r
                STATE_NAME:${feature.attributes.STATE_NAME}\n\r
                STATE_FIPS:${feature.attributes.STATE_FIPS}\n\r
                CNTY_FIPS:${feature.attributes.CNTY_FIPS}\n\r
                FIPS:${feature.attributes.FIPS}

              `;

              alert(content)
            }
          }
        }).catch(error => {
          console.error("点击事件处理时出错: ", error);
        });
      });
    });

    function filterByState(state) {
      const featureLayer = new FeatureLayer({
        url: featureLayerUrl
      });
      const query = createFeatureLayerQuery(featureLayer);

      queryAllFeatures(featureLayer, query).then(allFeaturesResult => {
        allFeatures.value = allFeaturesResult;
        populateTable(allFeaturesResult, state);
      }).catch(error => {
        console.error("查询特征时出错: ", error);
      });
    }

    // 创建 FeatureLayer 查询的函数
    function createFeatureLayerQuery(layer) {
      const query = layer.createQuery();
      query.outFields = ["NAME", "STATE_NAME", "STATE_FIPS", "CNTY_FIPS", "FIPS"];
      query.returnGeometry = false;
      query.num = 1000; // 每次请求获取的特征数量
      return query;
    }

    // 查询所有特征的函数
    function queryAllFeatures(layer, query) {
      let allFeaturesResult = [];

      function executeQuery(offset) {
        query.start = offset;
        return layer.queryFeatures(query).then(result => {
          allFeaturesResult = allFeaturesResult.concat(result.features);
          if (result.exceededTransferLimit) {
            // 如果还有更多特征需要获取,继续下一次偏移查询
            return executeQuery(offset + query.num);
          } else {
            return allFeaturesResult;
          }
        });
      }

      return executeQuery(0);
    }

    return {
      stateNames,
      filterByState
    };
  }
});
</script>

<style>
html, body, #viewDiv, #tableDiv {
  padding: 0;
  margin: 0;
  width: 100%;
}
#tableDiv {
  overflow: auto;
}
table {
  width: 100%;
  border-collapse: collapse;
}
th, td {
  padding: 8px;
  text-align: left;
  border: 1px solid #ddd;
}
th {
  background-color: #f2f2f2;
}
</style>
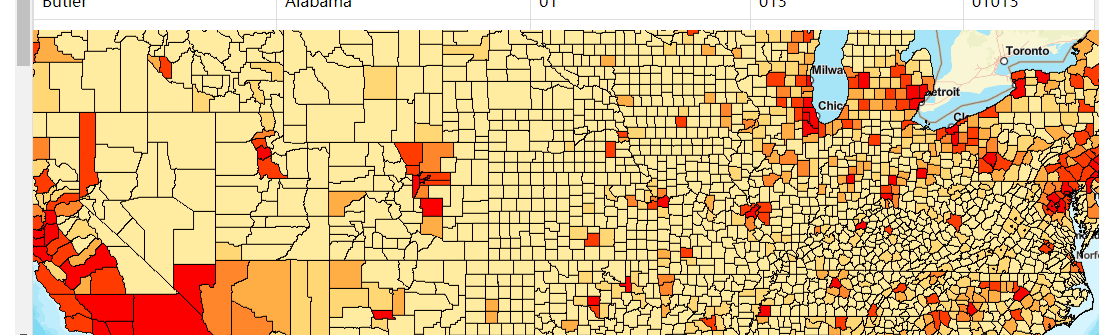
图层展示
地图地块展示,地块颜色根据字段“POP2000”,如果字段该数值为0至5万使用一个颜色,5万至10万使用一个颜色,10万至15万使用一个颜色,15万至20万使用一个颜色,20万至50万使用一个颜色,50万以上使用一个颜色
<template>
  <div style="display: flex; height: 100vh;">
    <!-- 左侧显示 STATE_NAME 列表 -->
    <div id="stateList" style="width: 20%; overflow-y: auto; border-right: 1px solid #ddd;">
      <ul>
        <li v-for="state in stateNames" :key="state" @click="filterByState(state)" style="cursor: pointer">
          {{ state }}
        </li>
      </ul>
    </div>

    <!-- 右侧显示表格和地图 -->
    <div style="width: 80%; display: flex; flex-direction: column;">
      <div id="tableDiv" style="height: 50%; overflow-y: auto;"></div>
      <div id="viewDiv" style="height: 50%;"></div>
    </div>
  </div>
</template>

<script>
import { defineComponent, onMounted, ref } from 'vue';
import Map from "@arcgis/core/Map";
import MapView from "@arcgis/core/views/MapView";
import FeatureLayer from "@arcgis/core/layers/FeatureLayer";
import SimpleRenderer from "@arcgis/core/renderers/SimpleRenderer";
import UniqueValueRenderer from "@arcgis/core/renderers/UniqueValueRenderer";
import ClassBreaksRenderer from "@arcgis/core/renderers/ClassBreaksRenderer";

export default defineComponent({
  name: "App",
  setup() {
    const stateNames = ref([]);
    const featuresByState = ref({});
    const allFeatures = ref([]);
    const featureLayerUrl = "https://sampleserver6.arcgisonline.com/arcgis/rest/services/Census/MapServer/2";

    // 创建并填充表格的函数
    function populateTable(features, state_name) {
      const tableDiv = document.getElementById("tableDiv");
      tableDiv.innerHTML = "";
      // Create table
      const table = document.createElement("table");

      // Create header row
      const headerRow = document.createElement("tr");
      const headers = ["NAME", "STATE_NAME", "STATE_FIPS", "CNTY_FIPS", "FIPS"];
      headers.forEach(headerText => {
        const th = document.createElement("th");
        th.textContent = headerText;
        headerRow.appendChild(th);
      });
      table.appendChild(headerRow);

      // Filter features to only include those with specified STATE_NAME
      if (!state_name) state_name = 'Alabama';
      console.log(state_name);
      const filteredFeatures = features.filter(feature => feature.attributes["STATE_NAME"] === state_name);

      // Populate table with filtered feature data
      filteredFeatures.forEach(feature => {
        const row = document.createElement("tr");
        headers.forEach(field => {
          const td = document.createElement("td");
          td.textContent = feature.attributes[field];
          row.appendChild(td);
        });
        table.appendChild(row);
      });

      // Append table to div
      tableDiv.appendChild(table);
    }

    onMounted(() => {
      // 创建地图并设置底图
      const map = new Map({
        basemap: "streets" // 可以选择任何预定义的底图
      });

      // 创建 MapView
      const view = new MapView({
        container: "viewDiv", // 引用 view div
        map: map, // 引用之前创建的地图对象
        zoom: 4, // 根据细节层次 (LOD) 设置缩放级别
        center: [-98.35, 39.50] // 使用经度、纬度设置视图中心点
      });

      // 定义基于 POP2000 字段的 ClassBreaksRenderer
      const renderer = new ClassBreaksRenderer({
        field: "POP2000",
        classBreakInfos: [
          {
            minValue: 0,
            maxValue: 50000,
            symbol: {
              type: "simple-fill",
              color: "#FFEDA0",
              outline: {
                width: 0.5,
                color: "black"
              }
            },
            label: "0 - 50,000"
          },
          {
            minValue: 50000,
            maxValue: 100000,
            symbol: {
              type: "simple-fill",
              color: "#FED976",
              outline: {
                width: 0.5,
                color: "black"
              }
            },
            label: "50,000 - 100,000"
          },
          {
            minValue: 100000,
            maxValue: 150000,
            symbol: {
              type: "simple-fill",
              color: "#FEB24C",
              outline: {
                width: 0.5,
                color: "black"
              }
            },
            label: "100,000 - 150,000"
          },
          {
            minValue: 150000,
            maxValue: 200000,
            symbol: {
              type: "simple-fill",
              color: "#FD8D3C",
              outline: {
                width: 0.5,
                color: "black"
              }
            },
            label: "150,000 - 200,000"
          },
          {
            minValue: 200000,
            maxValue: 500000,
            symbol: {
              type: "simple-fill",
              color: "#FC4E2A",
              outline: {
                width: 0.5,
                color: "black"
              }
            },
            label: "200,000 - 500,000"
          },
          {
            minValue: 500000,
            maxValue: Infinity,
            symbol: {
              type: "simple-fill",
              color: "#E31A1C",
              outline: {
                width: 0.5,
                color: "black"
              }
            },
            label: "500,000+"
          }
        ]
      });

      // 定义要添加的特定 FeatureLayer
      const featureLayer = new FeatureLayer({
        url: featureLayerUrl,
        outFields: ["NAME", "STATE_NAME", "STATE_FIPS", "CNTY_FIPS", "FIPS", "POP2000"],
        renderer: renderer, // 设置渲染器
        popupTemplate: {
          title: "{NAME}",
          content: [
            {
              type: "fields",
              fieldInfos: [
                { fieldName: "NAME", label: "Name" },
                { fieldName: "STATE_NAME", label: "State Name" },
                { fieldName: "STATE_FIPS", label: "State FIPS" },
                { fieldName: "CNTY_FIPS", label: "County FIPS" },
                { fieldName: "FIPS", label: "FIPS" },
                { fieldName: "POP2000", label: "Population 2000" }
              ]
            }
          ]
        }
      });

      map.add(featureLayer);

      // 查询 FeatureLayer 中的指定字段
      view.when(() => {
        const query = createFeatureLayerQuery(featureLayer);

        queryAllFeatures(featureLayer, query).then(allFeaturesResult => {
          allFeatures.value = allFeaturesResult;
          populateTable(allFeaturesResult);

          // 左侧数据
          const stateSet = new Set();
          allFeaturesResult.forEach(feature => {
            const state = feature.attributes.STATE_NAME;
            if (!featuresByState.value[state]) {
              featuresByState.value[state] = [];
            }
            featuresByState.value[state].push(feature);
            stateSet.add(state);
          });
          stateNames.value = Array.from(stateSet).sort();
        }).catch(error => {
          console.error("查询特征时出错: ", error);
        });
      });

      // 添加点击事件监听器
      view.on("click", (event) => {
        console.log("111")
        view.hitTest(event).then((response) => {

          const results = response.results;

          if (results.length > 0) {

            const filteredResults = results.filter(result => result.graphic.layer === featureLayer);
            if (filteredResults.length > 0) {
              const feature = filteredResults[0].graphic;

              let content= `
              NAME: ${feature.attributes.NAME} \n\r
                STATE_NAME:${feature.attributes.STATE_NAME}\n\r
                STATE_FIPS:${feature.attributes.STATE_FIPS}\n\r
                CNTY_FIPS:${feature.attributes.CNTY_FIPS}\n\r
                FIPS:${feature.attributes.FIPS}

              `;

              alert(content)
            }
          }
        }).catch(error => {
          console.error("点击事件处理时出错: ", error);
        });
      });
    });

    function filterByState(state) {
      const featureLayer = new FeatureLayer({
        url: featureLayerUrl
      });
      const query = createFeatureLayerQuery(featureLayer);

      queryAllFeatures(featureLayer, query).then(allFeaturesResult => {
        allFeatures.value = allFeaturesResult;
        populateTable(allFeaturesResult, state);
      }).catch(error => {
        console.error("查询特征时出错: ", error);
      });
    }

    // 创建 FeatureLayer 查询的函数
    function createFeatureLayerQuery(layer) {
      const query = layer.createQuery();
      query.outFields = ["NAME", "STATE_NAME", "STATE_FIPS", "CNTY_FIPS", "FIPS", "POP2000"];
      query.returnGeometry = false;
      query.num = 1000; // 每次请求获取的特征数量
      return query;
    }

    // 查询所有特征的函数
    function queryAllFeatures(layer, query) {
      let allFeaturesResult = [];

      function executeQuery(offset) {
        query.start = offset;
        return layer.queryFeatures(query).then(result => {
          allFeaturesResult = allFeaturesResult.concat(result.features);
          if (result.exceededTransferLimit) {
            // 如果还有更多特征需要获取,继续下一次偏移查询
            return executeQuery(offset + query.num);
          } else {
            return allFeaturesResult;
          }
        });
      }

      return executeQuery(0);
    }

    return {
      stateNames,
      filterByState
    };
  }
});
</script>

<style>
html, body, #viewDiv, #tableDiv {
  padding: 0;
  margin: 0;
  width: 100%;
}
#tableDiv {
  overflow: auto;
}
table {
  width: 100%;
  border-collapse: collapse;
}
th, td {
  padding: 8px;
  text-align: left;
  border: 1px solid #ddd;
}
th {
  background-color: #f2f2f2;
}
</style>
如果vue3+arcgis js api中。某个function 调用 amouted中的方法,无法调用该怎么办?

点击表格goto定位地图:
(题目:数据定位:点击右侧表格某条数据,地图聚焦定位到该地块,弹出该地块弹框)
<template>
  <div style="display: flex; height: 100vh;">
    <!-- 左侧显示 STATE_NAME 列表 -->
    <div id="stateList" style="width: 20%; overflow-y: auto; border-right: 1px solid #ddd;">
      <ul>
        <li v-for="state in stateNames" :key="state" @click="filterByState(state)" style="cursor: pointer">
          {{ state }}
        </li>
      </ul>
    </div>

    <!-- 右侧显示表格和地图 -->
    <div style="width: 80%; display: flex; flex-direction: column;">
      <div id="tableDiv" style="height: 50%; overflow-y: auto;"></div>
      <div id="viewDiv" style="height: 50%;"></div>
    </div>
  </div>
</template>

<script>
import { defineComponent, onMounted, ref } from 'vue';
import Map from "@arcgis/core/Map";
import MapView from "@arcgis/core/views/MapView";
import FeatureLayer from "@arcgis/core/layers/FeatureLayer";
import SimpleRenderer from "@arcgis/core/renderers/SimpleRenderer";
import UniqueValueRenderer from "@arcgis/core/renderers/UniqueValueRenderer";
import ClassBreaksRenderer from "@arcgis/core/renderers/ClassBreaksRenderer";

export default defineComponent({
  name: "App",
  setup() {
    const stateNames = ref([]);
    const featuresByState = ref({});
    const allFeatures = ref([]);

    const featureLayerUrl = "https://sampleserver6.arcgisonline.com/arcgis/rest/services/Census/MapServer/2";

    let view;
// 第一处populateTable
    function populateTable(features, state_name) {
      const tableDiv = document.getElementById("tableDiv");
      tableDiv.innerHTML = "";
      // Create table
      const table = document.createElement("table");

      // Create header row
      const headerRow = document.createElement("tr");
      const headers = ["NAME", "STATE_NAME", "STATE_FIPS", "CNTY_FIPS", "FIPS"];
      headers.forEach(headerText => {
        const th = document.createElement("th");
        th.textContent = headerText;
        headerRow.appendChild(th);
      });
      table.appendChild(headerRow);

      // Filter features to only include those with specified STATE_NAME
      if (!state_name) state_name = 'Alabama';
      console.log(state_name);
      const filteredFeatures = features.filter(feature => feature.attributes["STATE_NAME"] === state_name);

      // Populate table with filtered feature data
      filteredFeatures.forEach(feature => {
        const row = document.createElement("tr");
        headers.forEach(field => {
          const td = document.createElement("td");
          td.textContent = feature.attributes[field];
          row.appendChild(td);
        });
        row.style.cursor = "pointer";
        row.addEventListener("click", () => {
          // alert(1111)
          zoomToFeature(feature);
        });
        table.appendChild(row);
      });

      // Append table to div
      tableDiv.appendChild(table);
    }


    function zoomToFeature(feature) {
      view.goTo({
        target: feature.geometry,
        zoom: 4
      }).then(() => {
        // view.popup.open({
        //   features: [feature],
        //   location: feature.geometry
        // });

        let content= `
              NAME: ${feature.attributes.NAME} \n\r
                STATE_NAME:${feature.attributes.STATE_NAME}\n\r
                STATE_FIPS:${feature.attributes.STATE_FIPS}\n\r
                CNTY_FIPS:${feature.attributes.CNTY_FIPS}\n\r
                FIPS:${feature.attributes.FIPS}

              `;

        alert(content)


      });
    }

    onMounted(() => {
      // 创建地图并设置底图
      const map = new Map({
        basemap: "streets" // 可以选择任何预定义的底图
      });

      // 创建 MapView
       view = new MapView({
        container: "viewDiv", // 引用 view div
        map: map, // 引用之前创建的地图对象
        zoom: 4, // 根据细节层次 (LOD) 设置缩放级别
        center: [-98.35, 39.50] // 使用经度、纬度设置视图中心点
      });


      // 定义基于 POP2000 字段的 ClassBreaksRenderer
      const renderer = new ClassBreaksRenderer({
        field: "POP2000",
        classBreakInfos: [
          {
            minValue: 0,
            maxValue: 50000,
            symbol: {
              type: "simple-fill",
              color: "#FFEDA0",
              outline: {
                width: 0.5,
                color: "black"
              }
            },
            label: "0 - 50,000"
          },
          {
            minValue: 50000,
            maxValue: 100000,
            symbol: {
              type: "simple-fill",
              color: "#FED976",
              outline: {
                width: 0.5,
                color: "black"
              }
            },
            label: "50,000 - 100,000"
          },
          {
            minValue: 100000,
            maxValue: 150000,
            symbol: {
              type: "simple-fill",
              color: "#FEB24C",
              outline: {
                width: 0.5,
                color: "black"
              }
            },
            label: "100,000 - 150,000"
          },
          {
            minValue: 150000,
            maxValue: 200000,
            symbol: {
              type: "simple-fill",
              color: "#FD8D3C",
              outline: {
                width: 0.5,
                color: "black"
              }
            },
            label: "150,000 - 200,000"
          },
          {
            minValue: 200000,
            maxValue: 500000,
            symbol: {
              type: "simple-fill",
              color: "#FC4E2A",
              outline: {
                width: 0.5,
                color: "black"
              }
            },
            label: "200,000 - 500,000"
          },
          {
            minValue: 500000,
            maxValue: Infinity,
            symbol: {
              type: "simple-fill",
              color: "#E31A1C",
              outline: {
                width: 0.5,
                color: "black"
              }
            },
            label: "500,000+"
          }
        ]
      });

      // 定义要添加的特定 FeatureLayer
      const featureLayer = new FeatureLayer({
        url: featureLayerUrl,
        outFields: ["NAME", "STATE_NAME", "STATE_FIPS", "CNTY_FIPS", "FIPS", "POP2000"],
        renderer: renderer, // 设置渲染器
        popupTemplate: {
          title: "{NAME}",
          content: [
            {
              type: "fields",
              fieldInfos: [
                { fieldName: "NAME", label: "Name" },
                { fieldName: "STATE_NAME", label: "State Name" },
                { fieldName: "STATE_FIPS", label: "State FIPS" },
                { fieldName: "CNTY_FIPS", label: "County FIPS" },
                { fieldName: "FIPS", label: "FIPS" },
                { fieldName: "POP2000", label: "Population 2000" }
              ]
            }
          ]
        }
      });

      map.add(featureLayer);

      // 查询 FeatureLayer 中的指定字段
      view.when(() => {
        const query = createFeatureLayerQuery(featureLayer);

        queryAllFeatures(featureLayer, query).then(allFeaturesResult => {
          allFeatures.value = allFeaturesResult;
          populateTable(allFeaturesResult);

          // 左侧数据
          const stateSet = new Set();
          allFeaturesResult.forEach(feature => {
            const state = feature.attributes.STATE_NAME;
            if (!featuresByState.value[state]) {
              featuresByState.value[state] = [];
            }
            featuresByState.value[state].push(feature);
            stateSet.add(state);
          });
          stateNames.value = Array.from(stateSet).sort();
        }).catch(error => {
          console.error("查询特征时出错: ", error);
        });
      });

      // 添加点击事件监听器
      view.on("click", (event) => {
        console.log("点击了地图")
        view.hitTest(event).then((response) => {

          const results = response.results;

          if (results.length > 0) {

            const filteredResults = results.filter(result => result.graphic.layer === featureLayer);
            if (filteredResults.length > 0) {
              const feature = filteredResults[0].graphic;

              let content= `
              NAME: ${feature.attributes.NAME} \n\r
                STATE_NAME:${feature.attributes.STATE_NAME}\n\r
                STATE_FIPS:${feature.attributes.STATE_FIPS}\n\r
                CNTY_FIPS:${feature.attributes.CNTY_FIPS}\n\r
                FIPS:${feature.attributes.FIPS}

              `;

              alert(content)
            }
          }
        }).catch(error => {
          console.error("点击事件处理时出错: ", error);
        });
      });
    });

    function filterByState(state) {
      const featureLayer = new FeatureLayer({
        url: featureLayerUrl
      });
      const query = createFeatureLayerQuery(featureLayer);

      queryAllFeatures(featureLayer, query).then(allFeaturesResult => {
        allFeatures.value = allFeaturesResult;
        populateTable(allFeaturesResult, state);
      }).catch(error => {
        console.error("查询特征时出错: ", error);
      });
    }

    // 创建 FeatureLayer 查询的函数
    function createFeatureLayerQuery(layer) {
      const query = layer.createQuery();
      query.outFields = ["NAME", "STATE_NAME", "STATE_FIPS", "CNTY_FIPS", "FIPS", "POP2000"];
      query.returnGeometry = true;
      query.num = 1000; // 每次请求获取的特征数量
      return query;
    }

    // 查询所有特征的函数
    function queryAllFeatures(layer, query) {
      let allFeaturesResult = [];

      function executeQuery(offset) {
        query.start = offset;
        return layer.queryFeatures(query).then(result => {
          allFeaturesResult = allFeaturesResult.concat(result.features);
          if (result.exceededTransferLimit) {
            // 如果还有更多特征需要获取,继续下一次偏移查询
            return executeQuery(offset + query.num);
          } else {
            return allFeaturesResult;
          }
        });
      }

      return executeQuery(0);
    }

    return {
      stateNames,
      filterByState
    };
  }
});
</script>

<style>
html, body, #viewDiv, #tableDiv {
  padding: 0;
  margin: 0;
  width: 100%;
}
#tableDiv {
  overflow: auto;
}
table {
  width: 100%;
  border-collapse: collapse;
}
th, td {
  padding: 8px;
  text-align: left;
  border: 1px solid #ddd;
}
th {
  background-color: #f2f2f2;
}
</style>
自定义弹出框Mdal
<template>


  <div>
    <button @click="showModal = true">打开弹出框</button>

    <div v-if="showModal" class="modal-wrapper" @click="closeModal">
      <div class="modal-content" @click.stop>
        <h2>这是一个弹出框</h2>
        <p>这里是弹出框的内容</p>
        <button @click="closeModal">关闭</button>
      </div>
    </div>
  </div>


  <div style="display: flex; height: 100vh;">
    <!-- 左侧显示 STATE_NAME 列表 -->
    <div id="stateList" style="width: 20%; overflow-y: auto; border-right: 1px solid #ddd;">
      <ul>
        <li v-for="state in stateNames" :key="state" @click="filterByState(state)" style="cursor: pointer">
          {{ state }}
        </li>
      </ul>
    </div>

    <!-- 右侧显示表格和地图 -->
    <div style="width: 80%; display: flex; flex-direction: column;">
      <div id="tableDiv" style="height: 50%; overflow-y: auto;"></div>
      <div id="viewDiv" style="height: 50%;"></div>
    </div>
  </div>
</template>

<script>
import { defineComponent, onMounted, ref } from 'vue';
import Map from "@arcgis/core/Map";
import MapView from "@arcgis/core/views/MapView";
import FeatureLayer from "@arcgis/core/layers/FeatureLayer";
import Popup from "@arcgis/core/widgets/Popup";
import SimpleRenderer from "@arcgis/core/renderers/SimpleRenderer";
import UniqueValueRenderer from "@arcgis/core/renderers/UniqueValueRenderer";
import ClassBreaksRenderer from "@arcgis/core/renderers/ClassBreaksRenderer";

export default defineComponent({
  name: "App",
  setup() {
    const stateNames = ref([]);
    const featuresByState = ref({});
    const allFeatures = ref([]);
    const showModal = ref(false);
    const closeModal = () => {
      showModal.value = false;
    };

    const featureLayerUrl = "https://sampleserver6.arcgisonline.com/arcgis/rest/services/Census/MapServer/2";

    let view;


// 第一处populateTable
    function populateTable(features, state_name) {
      const tableDiv = document.getElementById("tableDiv");
      tableDiv.innerHTML = "";
      // Create table
      const table = document.createElement("table");

      // Create header row
      const headerRow = document.createElement("tr");
      const headers = ["NAME", "STATE_NAME", "STATE_FIPS", "CNTY_FIPS", "FIPS"];
      headers.forEach(headerText => {
        const th = document.createElement("th");
        th.textContent = headerText;
        headerRow.appendChild(th);
      });
      table.appendChild(headerRow);

      // Filter features to only include those with specified STATE_NAME
      if (!state_name) state_name = 'Alabama';
      console.log(state_name);
      const filteredFeatures = features.filter(feature => feature.attributes["STATE_NAME"] === state_name);

      // Populate table with filtered feature data
      filteredFeatures.forEach(feature => {
        const row = document.createElement("tr");
        headers.forEach(field => {
          const td = document.createElement("td");
          td.textContent = feature.attributes[field];
          row.appendChild(td);
        });
        row.style.cursor = "pointer";
        row.addEventListener("click", () => {
          // alert(1111)
          zoomToFeature(feature);
        });
        table.appendChild(row);
      });

      // Append table to div
      tableDiv.appendChild(table);
    }


    function zoomToFeature(feature) {
      view.goTo({
        target: feature.geometry,
        zoom: 4
      }).then(() => {
        // view.popup.open({
        //   features: [feature],
        //   location: feature.geometry
        // });

        let content= `
              NAME: ${feature.attributes.NAME} \n\r
                STATE_NAME:${feature.attributes.STATE_NAME}\n\r
                STATE_FIPS:${feature.attributes.STATE_FIPS}\n\r
                CNTY_FIPS:${feature.attributes.CNTY_FIPS}\n\r
                FIPS:${feature.attributes.FIPS}

              `;

        alert(content)


      });
    }

    onMounted(() => {
      // 创建地图并设置底图
      const map = new Map({
        basemap: "streets" // 可以选择任何预定义的底图
      });

      // 创建 MapView
      view = new MapView({
        container: "viewDiv", // 引用 view div
        map: map, // 引用之前创建的地图对象
        zoom: 4, // 根据细节层次 (LOD) 设置缩放级别
        center: [-98.35, 39.50] // 使用经度、纬度设置视图中心点
      });


      // 定义基于 POP2000 字段的 ClassBreaksRenderer
      const renderer = new ClassBreaksRenderer({
        field: "POP2000",
        classBreakInfos: [
          {
            minValue: 0,
            maxValue: 50000,
            symbol: {
              type: "simple-fill",
              color: "#FFEDA0",
              outline: {
                width: 0.5,
                color: "black"
              }
            },
            label: "0 - 50,000"
          },
          {
            minValue: 50000,
            maxValue: 100000,
            symbol: {
              type: "simple-fill",
              color: "#FED976",
              outline: {
                width: 0.5,
                color: "black"
              }
            },
            label: "50,000 - 100,000"
          },
          {
            minValue: 100000,
            maxValue: 150000,
            symbol: {
              type: "simple-fill",
              color: "#FEB24C",
              outline: {
                width: 0.5,
                color: "black"
              }
            },
            label: "100,000 - 150,000"
          },
          {
            minValue: 150000,
            maxValue: 200000,
            symbol: {
              type: "simple-fill",
              color: "#FD8D3C",
              outline: {
                width: 0.5,
                color: "black"
              }
            },
            label: "150,000 - 200,000"
          },
          {
            minValue: 200000,
            maxValue: 500000,
            symbol: {
              type: "simple-fill",
              color: "#FC4E2A",
              outline: {
                width: 0.5,
                color: "black"
              }
            },
            label: "200,000 - 500,000"
          },
          {
            minValue: 500000,
            maxValue: Infinity,
            symbol: {
              type: "simple-fill",
              color: "#E31A1C",
              outline: {
                width: 0.5,
                color: "black"
              }
            },
            label: "500,000+"
          }
        ]
      });

      // 定义要添加的特定 FeatureLayer
      const featureLayer = new FeatureLayer({
        url: featureLayerUrl,
        outFields: ["NAME", "STATE_NAME", "STATE_FIPS", "CNTY_FIPS", "FIPS", "POP2000"],
        renderer: renderer, // 设置渲染器
        popupTemplate: {
          title: "{NAME}",
          content: [
            {
              type: "fields",
              fieldInfos: [
                { fieldName: "NAME", label: "Name" },
                { fieldName: "STATE_NAME", label: "State Name" },
                { fieldName: "STATE_FIPS", label: "State FIPS" },
                { fieldName: "CNTY_FIPS", label: "County FIPS" },
                { fieldName: "FIPS", label: "FIPS" },
                { fieldName: "POP2000", label: "Population 2000" }
              ]
            }
          ]
        }
      });

      map.add(featureLayer);

      // 查询 FeatureLayer 中的指定字段
      view.when(() => {

        view.popup.open({
          title: 'Feature Information',
          content: 'Feature Information',
          location: view.center // You can specify the location for the popup
        });


        const query = createFeatureLayerQuery(featureLayer);

        queryAllFeatures(featureLayer, query).then(allFeaturesResult => {
          allFeatures.value = allFeaturesResult;
          populateTable(allFeaturesResult);

          // 左侧数据
          const stateSet = new Set();
          allFeaturesResult.forEach(feature => {
            const state = feature.attributes.STATE_NAME;
            if (!featuresByState.value[state]) {
              featuresByState.value[state] = [];
            }
            featuresByState.value[state].push(feature);
            stateSet.add(state);
          });
          stateNames.value = Array.from(stateSet).sort();
        }).catch(error => {
          console.error("查询特征时出错: ", error);
        });
      });

      // 添加点击事件监听器
      view.on("click", (event) => {
        console.log("点击了地图")
        view.hitTest(event).then((response) => {

          const results = response.results;

          if (results.length > 0) {

            const filteredResults = results.filter(result => result.graphic.layer === featureLayer);
            if (filteredResults.length > 0) {
              const feature = filteredResults[0].graphic;

              let content= `
              NAME: ${feature.attributes.NAME} \n\r
                STATE_NAME:${feature.attributes.STATE_NAME}\n\r
                STATE_FIPS:${feature.attributes.STATE_FIPS}\n\r
                CNTY_FIPS:${feature.attributes.CNTY_FIPS}\n\r
                FIPS:${feature.attributes.FIPS}

              `;

              alert(content)
            }
          }
        }).catch(error => {
          console.error("点击事件处理时出错: ", error);
        });
      });
    });

    function filterByState(state) {
      const featureLayer = new FeatureLayer({
        url: featureLayerUrl
      });
      const query = createFeatureLayerQuery(featureLayer);

      queryAllFeatures(featureLayer, query).then(allFeaturesResult => {
        allFeatures.value = allFeaturesResult;
        populateTable(allFeaturesResult, state);
      }).catch(error => {
        console.error("查询特征时出错: ", error);
      });
    }


    // 创建 FeatureLayer 查询的函数
    function createFeatureLayerQuery(layer) {
      const query = layer.createQuery();
      query.outFields = ["NAME", "STATE_NAME", "STATE_FIPS", "CNTY_FIPS", "FIPS", "POP2000"];
      query.returnGeometry = true;
      query.num = 1000; // 每次请求获取的特征数量
      return query;
    }

    // 查询所有特征的函数
    function queryAllFeatures(layer, query) {
      let allFeaturesResult = [];

      function executeQuery(offset) {
        query.start = offset;
        return layer.queryFeatures(query).then(result => {
          allFeaturesResult = allFeaturesResult.concat(result.features);
          if (result.exceededTransferLimit) {
            // 如果还有更多特征需要获取,继续下一次偏移查询
            return executeQuery(offset + query.num);
          } else {
            return allFeaturesResult;
          }
        });
      }

      return executeQuery(0);
    }

    return {
      stateNames,
      filterByState,
      showModal,
      closeModal
    };
  }
});
</script>

<style>
html, body, #viewDiv, #tableDiv {
  padding: 0;
  margin: 0;
  width: 100%;
}
#tableDiv {
  overflow: auto;
}
table {
  width: 100%;
  border-collapse: collapse;
}
th, td {
  padding: 8px;
  text-align: left;
  border: 1px solid #ddd;
}
th {
  background-color: #f2f2f2;
}


.modal-wrapper {
  position: fixed;
  top: 0;
  left: 0;
  width: 100%;
  height: 100%;
  background-color: rgba(0, 0, 0, 0.5);
  display: flex;
  justify-content: center;
  align-items: center;
}

.modal-content {
  background-color: white;
  padding: 20px;
  border-radius: 5px;
  box-shadow: 0px 0px 10px rgba(0, 0, 0, 0.5);
}

button {
  margin-top: 10px;
}

</style>
画一个饼图:
npm下载:
npm install echarts --save<template> <div ref="chartRef" style="width: 600px;height:400px;"></div> </template> <script> import { ref, onMounted, onUnmounted } from 'vue'; import * as echarts from 'echarts'; export default { name: 'App', setup() { const chartRef = ref(null); let chartInstance = null; onMounted(() => { // 基于准备好的dom,初始化echarts实例 chartInstance = echarts.init(chartRef.value); // 指定图表的配置项和数据 let option = { title: { text: '饼图示例', left: 'center' }, tooltip: { trigger: 'item' }, legend: { orient: 'vertical', left: 'left', }, series: [ { name: '访问来源', type: 'pie', radius: '55%', data: [ {value: 1048, name: '搜索引擎'}, {value: 735, name: '直接访问'}, {value: 580, name: '邮件营销'}, {value: 484, name: '联盟广告'}, {value: 300, name: '视频广告'} ], emphasis: { itemStyle: { shadowBlur: 10, shadowOffsetX: 0, shadowColor: 'rgba(0, 0, 0, 0.5)' } } } ] }; // 使用刚指定的配置项和数据显示图表。 chartInstance.setOption(option); }); onUnmounted(() => { // 组件销毁时,释放echarts实例 if (chartInstance) { chartInstance.dispose(); } }); return { chartRef }; } }; </script> <style scoped> /* 样式可以放在这里 */ </style>
画一个饼图(在弹出框中显示,所以使用nextTick)
<template>
  <div style="display: flex; height: 100vh;">
    <!-- 左侧显示 STATE_NAME 列表 -->
    <div id="stateList" style="width: 20%; overflow-y: auto; border-right: 1px solid #ddd;">
      <!-- 添加 STATE_NAME 列表内容 -->
    </div>

    <!-- 右侧显示表格和地图 -->
    <div style="width: 80%; display: flex; flex-direction: column;">
      <div id="viewModal">
        <button @click="showModalClick">查看饼图</button>

        <div v-if="showModal" class="modal-wrapper" @click="closeModal">
          <div id="customModal" class="modal-content" @click.stop>
            <div ref="chartRef" style="width: 300px;height:200px;"></div>
            <button @click="closeModal">关闭</button>
          </div>
        </div>
      </div>
    </div>
  </div>
</template>

<script>
import { defineComponent, onMounted, ref, nextTick } from 'vue';
import * as echarts from 'echarts';

export default defineComponent({
  name: "App",

  setup() {
    const showModal = ref(false);
    const chartRef = ref(null);
    let chartInstance = null;

    const closeModal = () => {
      showModal.value = false;
      if (chartInstance) {
        chartInstance.dispose();
      }
    };

    const showModalClick = () => {
      showModal.value = true;
      nextTick(() => {
        if (chartRef.value) {
          chartInstance = echarts.init(chartRef.value);
          const option = {
            title: {
              text: '饼图示例',
              left: 'center'
            },
            tooltip: {
              trigger: 'item'
            },
            legend: {
              orient: 'vertical',
              left: 'left',
            },
            series: [
              {
                name: '访问来源',
                type: 'pie',
                radius: '55%',
                data: [
                  { value: 1048, name: '搜索引擎' },
                  { value: 735, name: '直接访问' },
                  { value: 580, name: '邮件营销' },
                  { value: 484, name: '联盟广告' },
                  { value: 300, name: '视频广告' }
                ],
                emphasis: {
                  itemStyle: {
                    shadowBlur: 10,
                    shadowOffsetX: 0,
                    shadowColor: 'rgba(0, 0, 0, 0.5)'
                  }
                }
              }
            ]
          };
          chartInstance.setOption(option);
        }
      });
    };

    onMounted(() => {
      // 在这里初始化地图或其他内容
    });

    return {
      showModal,
      closeModal,
      chartRef,
      showModalClick
    };
  }
});
</script>

<style>
html, body, #viewDiv, #tableDiv {
  padding: 0;
  margin: 0;
  width: 100%;
}

#tableDiv {
  overflow: auto;
}

table {
  width: 100%;
  border-collapse: collapse;
}

th, td {
  padding: 8px;
  text-align: left;
  border: 1px solid #ddd;
}

th {
  background-color: #f2f2f2;
}

.modal-wrapper {
  position: fixed;
  top: 0;
  left: 0;
  width: 100%;
  height: 100%;
  background-color: rgba(0, 0, 0, 0.5);
  display: flex;
  justify-content: center;
  align-items: center;
}

.modal-content {
  background-color: white;
  padding: 20px;
  border-radius: 5px;
  box-shadow: 0px 0px 10px rgba(0, 0, 0, 0.5);
}

button {
  margin-top: 10px;
}
</style>
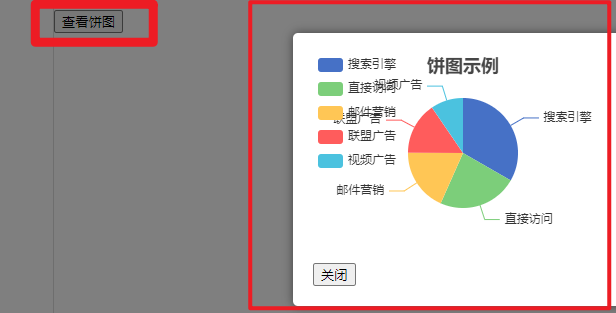
点击按钮查看饼图:
下载chart
npm install chart.js vue-chartjs
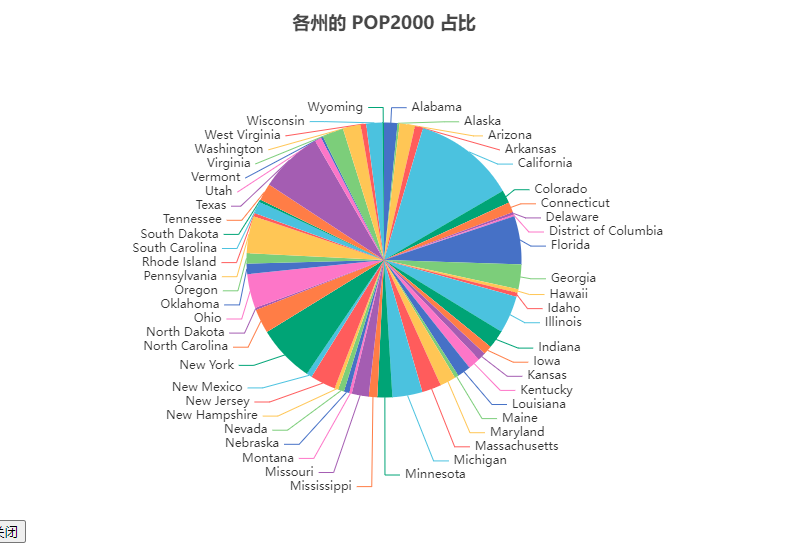
查看POP2000占比图
<template>


  <div style="display: flex; height: 100vh;">
    <!-- 左侧显示 STATE_NAME 列表 -->
    <div id="stateList" style="width: 20%; overflow-y: auto; border-right: 1px solid #ddd;">
      <ul>
        <li v-for="state in stateNames" :key="state" @click="filterByState(state)" style="cursor: pointer">
          {{ state }}
        </li>
      </ul>
    </div>

    <!-- 右侧显示表格和地图 -->
    <div style="width: 80%; display: flex; flex-direction: column;">
      <div id="viewModal">
        <button @click="showModalClick()">查看POP2000占比图</button>


        <div v-if="showModal" class="modal-wrapper" @click="closeModal">
          <div id="customModal" class="modal-content" @click.stop>
            <div ref="chartRef" style="width: 800px;height:500px;"></div>
            <button @click="closeModal">关闭</button>
          </div>
        </div>
      </div>


      <div id="tableDiv" style="height: 50%; overflow-y: auto;"></div>
      <div id="viewDiv" style="height: 40%;"></div>


    </div>
  </div>
</template>

<script>
import {defineComponent, nextTick, onMounted, onUnmounted, ref} from 'vue';
import Map from "@arcgis/core/Map";
import MapView from "@arcgis/core/views/MapView";
import FeatureLayer from "@arcgis/core/layers/FeatureLayer";
import Popup from "@arcgis/core/widgets/Popup";
import SimpleRenderer from "@arcgis/core/renderers/SimpleRenderer";
import UniqueValueRenderer from "@arcgis/core/renderers/UniqueValueRenderer";
import ClassBreaksRenderer from "@arcgis/core/renderers/ClassBreaksRenderer";
import * as echarts from 'echarts';

export default defineComponent({
  name: "App",

  setup() {
    const stateNames = ref([]);
    const featuresByState = ref({});
    const allFeatures = ref([]);
    const showModal = ref(false);
    let pieChartData = ref([]);
    const closeModal = () => {
      showModal.value = false;
    };

    const chartRef = ref(null);
    let chartInstance = null;

    const featureLayerUrl = "https://sampleserver6.arcgisonline.com/arcgis/rest/services/Census/MapServer/2";

    let view;


    const showModalClick = () => {
      showModal.value = true;
      nextTick(() => {
        if (chartRef.value) {
          chartInstance = echarts.init(chartRef.value);
          // 初始化后调用更新函数来设置初始数据

          updatePieChart(pieChartData); // 使用空数组作为初始数据
        }
      });
    };


// 第一处populateTable
    function populateTable(features, state_name) {
      const tableDiv = document.getElementById("tableDiv");
      tableDiv.innerHTML = "";
      // Create table
      const table = document.createElement("table");

      // Create header row
      const headerRow = document.createElement("tr");
      const headers = ["NAME", "STATE_NAME", "STATE_FIPS", "CNTY_FIPS", "FIPS"];
      headers.forEach(headerText => {
        const th = document.createElement("th");
        th.textContent = headerText;
        headerRow.appendChild(th);
      });
      table.appendChild(headerRow);

      // Filter features to only include those with specified STATE_NAME
      if (!state_name) state_name = 'Alabama';
      console.log(state_name);
      const filteredFeatures = features.filter(feature => feature.attributes["STATE_NAME"] === state_name);

      // Populate table with filtered feature data
      filteredFeatures.forEach(feature => {
        const row = document.createElement("tr");
        headers.forEach(field => {
          const td = document.createElement("td");
          td.textContent = feature.attributes[field];
          row.appendChild(td);
        });
        row.style.cursor = "pointer";
        row.addEventListener("click", () => {
          // alert(1111)
          zoomToFeature(feature);
        });
        table.appendChild(row);
      });

      // Append table to div
      tableDiv.appendChild(table);
    }


    function zoomToFeature(feature) {
      view.goTo({
        target: feature.geometry,
        zoom: 4
      }).then(() => {
        // view.popup.open({
        //   features: [feature],
        //   location: feature.geometry
        // });

        let content = `
              NAME: ${feature.attributes.NAME} \n\r
                STATE_NAME:${feature.attributes.STATE_NAME}\n\r
                STATE_FIPS:${feature.attributes.STATE_FIPS}\n\r
                CNTY_FIPS:${feature.attributes.CNTY_FIPS}\n\r
                FIPS:${feature.attributes.FIPS}

              `;

        alert(content)


      });
    }

    onMounted(() => {
      // 创建地图并设置底图
      const map = new Map({
        basemap: "streets" // 可以选择任何预定义的底图
      });

      // 创建 MapView
      view = new MapView({
        container: "viewDiv", // 引用 view div
        map: map, // 引用之前创建的地图对象
        zoom: 4, // 根据细节层次 (LOD) 设置缩放级别
        center: [-98.35, 39.50] // 使用经度、纬度设置视图中心点
      });


      // 定义基于 POP2000 字段的 ClassBreaksRenderer
      const renderer = new ClassBreaksRenderer({
        field: "POP2000",
        classBreakInfos: [
          {
            minValue: 0,
            maxValue: 50000,
            symbol: {
              type: "simple-fill",
              color: "#FFEDA0",
              outline: {
                width: 0.5,
                color: "black"
              }
            },
            label: "0 - 50,000"
          },
          {
            minValue: 50000,
            maxValue: 100000,
            symbol: {
              type: "simple-fill",
              color: "#FED976",
              outline: {
                width: 0.5,
                color: "black"
              }
            },
            label: "50,000 - 100,000"
          },
          {
            minValue: 100000,
            maxValue: 150000,
            symbol: {
              type: "simple-fill",
              color: "#FEB24C",
              outline: {
                width: 0.5,
                color: "black"
              }
            },
            label: "100,000 - 150,000"
          },
          {
            minValue: 150000,
            maxValue: 200000,
            symbol: {
              type: "simple-fill",
              color: "#FD8D3C",
              outline: {
                width: 0.5,
                color: "black"
              }
            },
            label: "150,000 - 200,000"
          },
          {
            minValue: 200000,
            maxValue: 500000,
            symbol: {
              type: "simple-fill",
              color: "#FC4E2A",
              outline: {
                width: 0.5,
                color: "black"
              }
            },
            label: "200,000 - 500,000"
          },
          {
            minValue: 500000,
            maxValue: Infinity,
            symbol: {
              type: "simple-fill",
              color: "#E31A1C",
              outline: {
                width: 0.5,
                color: "black"
              }
            },
            label: "500,000+"
          }
        ]
      });

      // 定义要添加的特定 FeatureLayer
      const featureLayer = new FeatureLayer({
        url: featureLayerUrl,
        outFields: ["NAME", "STATE_NAME", "STATE_FIPS", "CNTY_FIPS", "FIPS", "POP2000"],
        renderer: renderer, // 设置渲染器
        popupTemplate: {
          title: "{NAME}",
          content: [
            {
              type: "fields",
              fieldInfos: [
                {fieldName: "NAME", label: "Name"},
                {fieldName: "STATE_NAME", label: "State Name"},
                {fieldName: "STATE_FIPS", label: "State FIPS"},
                {fieldName: "CNTY_FIPS", label: "County FIPS"},
                {fieldName: "FIPS", label: "FIPS"},
                {fieldName: "POP2000", label: "Population 2000"}
              ]
            }
          ]
        }
      });

      map.add(featureLayer);

      // 查询 FeatureLayer 中的指定字段
      view.when(() => {


        const query = createFeatureLayerQuery(featureLayer);

        queryAllFeatures(featureLayer, query).then(allFeaturesResult => {
          allFeatures.value = allFeaturesResult;
          populateTable(allFeaturesResult);

          // 左侧数据
          const stateSet = new Set();
          const pop2000ByState = {};
          allFeaturesResult.forEach(feature => {
            const state = feature.attributes.STATE_NAME;
            const pop2000 = feature.attributes.POP2000 || 0;
            if (!featuresByState.value[state]) {
              featuresByState.value[state] = [];
            }
            featuresByState.value[state].push(feature);


            if (!pop2000ByState[state]) {
              pop2000ByState[state] = 0;
            }
            pop2000ByState[state] += pop2000;
            stateSet.add(state);


          });
          stateNames.value = Array.from(stateSet).sort();


          // 更新数据以用于饼图
          pieChartData = Object.keys(pop2000ByState).map(state => {
            return {name: state, value: pop2000ByState[state]};
          });


        }).catch(error => {
          console.error("查询特征时出错: ", error);
        });
      });


      // 添加点击事件监听器
      view.on("click", (event) => {
        console.log("点击了地图")
        view.hitTest(event).then((response) => {

          const results = response.results;

          if (results.length > 0) {

            const filteredResults = results.filter(result => result.graphic.layer === featureLayer);
            if (filteredResults.length > 0) {
              const feature = filteredResults[0].graphic;

              let content = `
              NAME: ${feature.attributes.NAME} \n\r
                STATE_NAME:${feature.attributes.STATE_NAME}\n\r
                STATE_FIPS:${feature.attributes.STATE_FIPS}\n\r
                CNTY_FIPS:${feature.attributes.CNTY_FIPS}\n\r
                FIPS:${feature.attributes.FIPS}

              `;

              alert(content)
            }
          }
        }).catch(error => {
          console.error("点击事件处理时出错: ", error);
        });
      });


    });

    onUnmounted(() => {
      // 组件销毁时,释放echarts实例
      if (chartInstance) {
        chartInstance.dispose();
      }
    });

    const updatePieChart = (data) => {

      const option = {
        title: {
          text: '各州的 POP2000 占比',
          left: 'center'
        },
        tooltip: {
          trigger: 'item'
        },

        series: [
          {
            name: 'POP2000',
            type: 'pie',
            radius: '55%',
            data: data,
            emphasis: {
              itemStyle: {
                shadowBlur: 10,
                shadowOffsetX: 0,
                shadowColor: 'rgba(0, 0, 0, 0.5)'
              }
            }
          }
        ]
      };
      chartInstance.setOption(option);
    };

    function filterByState(state) {
      const featureLayer = new FeatureLayer({
        url: featureLayerUrl
      });
      const query = createFeatureLayerQuery(featureLayer);

      queryAllFeatures(featureLayer, query).then(allFeaturesResult => {
        allFeatures.value = allFeaturesResult;
        populateTable(allFeaturesResult, state);
      }).catch(error => {
        console.error("查询特征时出错: ", error);
      });
    }


    // 创建 FeatureLayer 查询的函数
    function createFeatureLayerQuery(layer) {
      const query = layer.createQuery();
      query.outFields = ["NAME", "STATE_NAME", "STATE_FIPS", "CNTY_FIPS", "FIPS", "POP2000"];
      query.returnGeometry = true;
      query.num = 1000; // 每次请求获取的特征数量
      return query;
    }

    // 查询所有特征的函数
    function queryAllFeatures(layer, query) {
      let allFeaturesResult = [];

      function executeQuery(offset) {
        query.start = offset;
        return layer.queryFeatures(query).then(result => {
          allFeaturesResult = allFeaturesResult.concat(result.features);
          if (result.exceededTransferLimit) {
            // 如果还有更多特征需要获取,继续下一次偏移查询
            return executeQuery(offset + query.num);
          } else {
            return allFeaturesResult;
          }
        });
      }

      return executeQuery(0);
    }

    return {
      stateNames,
      filterByState,
      showModal,
      closeModal,
      chartRef,
      showModalClick

    };
  }
});
</script>

<style>
html, body, #viewDiv, #tableDiv {
  padding: 0;
  margin: 0;
  width: 100%;
}

#tableDiv {
  overflow: auto;
}

table {
  width: 100%;
  border-collapse: collapse;
}

th, td {
  padding: 8px;
  text-align: left;
  border: 1px solid #ddd;
}

th {
  background-color: #f2f2f2;
}


.modal-wrapper {
  position: fixed;
  top: 0;
  left: 0;
  width: 100%;
  height: 100%;
  background-color: rgba(0, 0, 0, 0.5);
  display: flex;
  justify-content: center;
  align-items: center;
}

.modal-content {
  background-color: white;
  padding: 20px;
  border-radius: 5px;
  box-shadow: 0px 0px 10px rgba(0, 0, 0, 0.5);
}

button {
  margin-top: 10px;
}

</style>


 1万+
1万+

 被折叠的 条评论
为什么被折叠?
被折叠的 条评论
为什么被折叠?
 到【灌水乐园】发言


