


 本文介绍了如何使用JFreeChart库在Java中创建2D及3D折线图,包括设置标题、轴标签、数据集、背景色、网格线、线条样式、数据点颜色和显示属性等细节。
String sql = "select count(id) num, DATE_FORMAT(calltime, '%Y年%m月') ym,modulename mn from tongji t group by DATE_FORMAT(calltime, '%Y年%m月'),mn";
List list = getList(sql);
// 绘图数据集
DefaultCategoryDataset dataSet = new DefaultCategoryDataset();
for (Object obj : list) {
Map map = (Map) obj;
dataSet.setValue((Long) map.get("num"), (String) map.get("mn"), map.get("ym").toString());
}
//如果把createLineChart改为createLineChart3D就变为了3D效果的折线图
JFreeChart chart = ChartFactory.createLineChart("图表标题", "X轴标题", "Y轴标题", dataSet,
PlotOrientation.VERTICAL, // 绘制方向
true, // 显示图例
true, // 采用标准生成器
false // 是否生成超链接
);
chart.getTitle().setFont(titleFont); // 设置标题字体
chart.getLegend().setItemFont(font);// 设置图例类别字体
chart.setBackgroundPaint(bgColor);// 设置背景色
//获取绘图区对象
CategoryPlot plot = chart.getCategoryPlot();
plot.setBackgroundPaint(Color.LIGHT_GRAY); // 设置绘图区背景色
plot.setRangeGridlinePaint(Color.WHITE); // 设置水平方向背景线颜色
plot.setRangeGridlinesVisible(true);// 设置是否显示水平方向背景线,默认值为true
plot.setDomainGridlinePaint(Color.WHITE); // 设置垂直方向背景线颜色
plot.setDomainGridlinesVisible(true); // 设置是否显示垂直方向背景线,默认值为false
CategoryAxis domainAxis = plot.getDomainAxis();
domainAxis.setLabelFont(font); // 设置横轴字体
domainAxis.setTickLabelFont(font);// 设置坐标轴标尺值字体
domainAxis.setLowerMargin(0.01);// 左边距 边框距离
domainAxis.setUpperMargin(0.06);// 右边距 边框距离,防止最后边的一个数据靠近了坐标轴。
domainAxis.setMaximumCategoryLabelLines(2);
ValueAxis rangeAxis = plot.getRangeAxis();
rangeAxis.setLabelFont(font);
rangeAxis.setStandardTickUnits(NumberAxis.createIntegerTickUnits());//Y轴显示整数
rangeAxis.setAutoRangeMinimumSize(1); //最小跨度
rangeAxis.setUpperMargin(0.18);//上边距,防止最大的一个数据靠近了坐标轴。
rangeAxis.setLowerBound(0); //最小值显示0
rangeAxis.setAutoRange(false); //不自动分配Y轴数据
rangeAxis.setTickMarkStroke(new BasicStroke(1.6f)); // 设置坐标标记大小
rangeAxis.setTickMarkPaint(Color.BLACK); // 设置坐标标记颜色
// 获取折线对象
LineAndShapeRenderer renderer = (LineAndShapeRenderer) plot.getRenderer();
BasicStroke realLine = new BasicStroke(1.8f); // 设置实线
// 设置虚线
float dashes[] = { 5.0f };
BasicStroke brokenLine = new BasicStroke(2.2f, // 线条粗细
BasicStroke.CAP_ROUND, // 端点风格
BasicStroke.JOIN_ROUND, // 折点风格
8f, dashes, 0.6f);
for (int i = 0; i
if (i % 2 == 0)
renderer.setSeriesStroke(i, realLine); // 利用实线绘制
else
renderer.setSeriesStroke(i, brokenLine); // 利用虚线绘制
}
plot.setNoDataMessage("无对应的数据,请重新查询。");
plot.setNoDataMessageFont(titleFont);//字体的大小
plot.setNoDataMessagePaint(Color.RED);//字体颜色
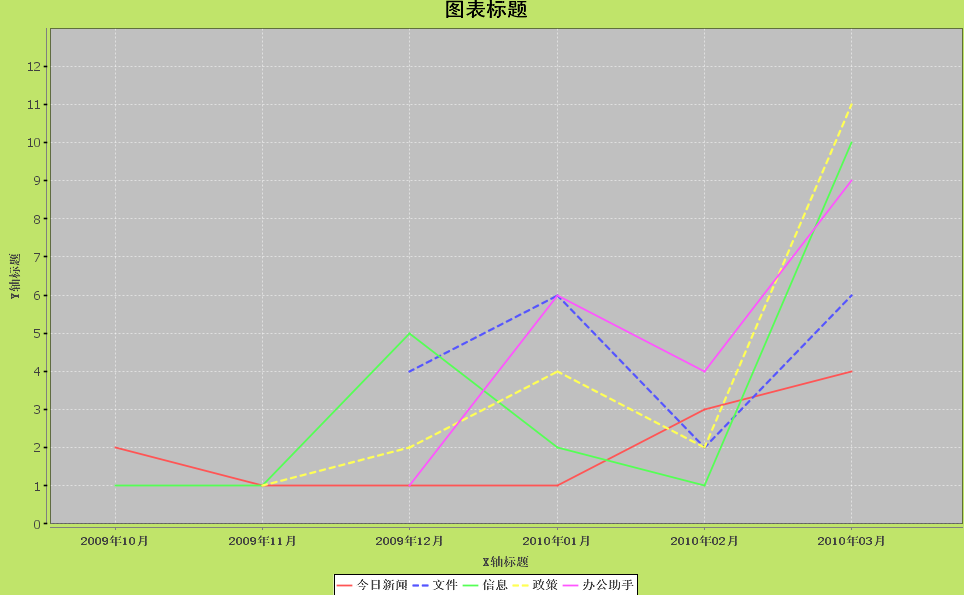
平面折线图效果
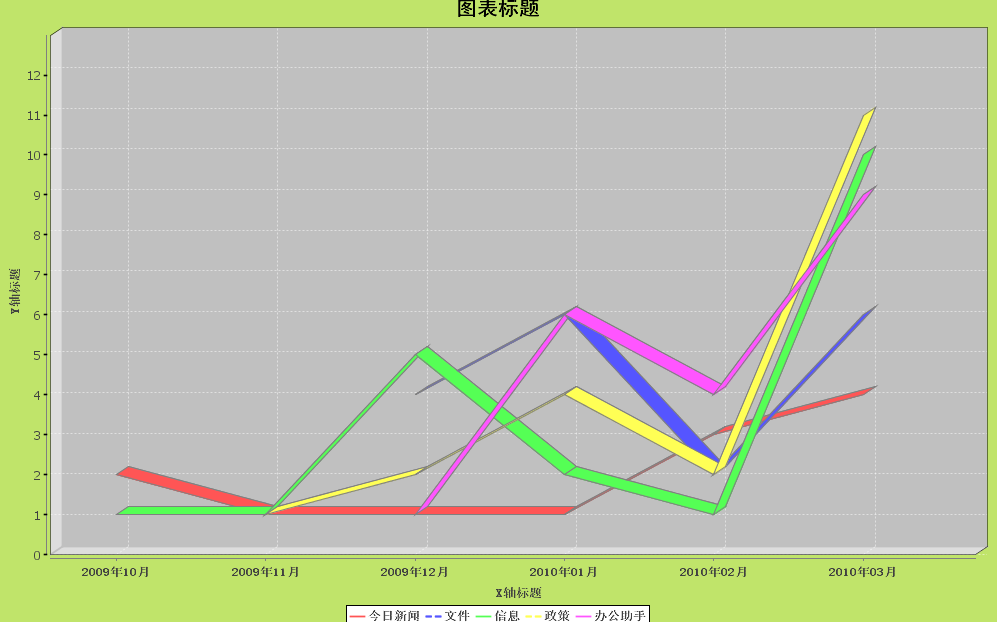
3D折线图效果:
设置线条、数据点颜色和显示属性
CategoryPlot mPlot = (CategoryPlot)mChart.getPlot();
mPlot.setBackgroundPaint(Color.WHITE);// 设置绘图区背景色
mPlot.setRangeGridlinePaint(Color.BLUE);//背景底部横虚线
mPlot.setOutlinePaint(Color.RED);//边界线
mPlot.setDomainGridlinePaint(Color.BLUE); // 设置垂直方向背景线颜色
mPlot.setDomainGridlinesVisible(true); // 设置是否显示垂直方向背景线,默认值为false
LineAndShapeRenderer lasp = (LineAndShapeRenderer) mPlot.getRenderer();// 获取显示线条的对象
lasp.setBaseShapesVisible(true);// 设置拐点是否可见/是否显示拐点
lasp.setDrawOutlines(true);// 设置拐点不同用不同的形状
lasp.setUseFillPaint(true);// 设置线条是否被显示填充颜色
lasp.setBaseFillPaint(Color.BLACK); 设置拐点颜色
//lasp.setSeriesPaint(series, paint);


 2425
2425

 被折叠的 条评论
为什么被折叠?
被折叠的 条评论
为什么被折叠?
 到【灌水乐园】发言


