


 本文介绍了如何检测和优化Linux系统中的网络延迟问题。通过使用ping、traceroute、hping3等工具进行网络延迟测试,并通过案例分析展示了如何利用wrk、tcpdump和Wireshark定位网络延迟原因。最后,提到了Nagle算法和TCP_NODELAY选项对网络延迟的影响,以及如何调整配置以改善性能。
目录
网络延迟
案例分析
总结
网络延迟
常用的是双向的往返通信延迟,比如 ping 测试的结果,就是往返延时 RTT(Round-Trip Time)
除了网络延迟外,另一个常用的指标是应用程序延迟,它是指,从应用程序接收到请求,再到发回响应,全程所用的时间。
通常,应用程序延迟也指的是往返延迟,是网络数据传输时间加上数据处理时间的和。
可以用 ping 来测试网络延迟。ping 基于 ICMP 协议,它通过计算 ICMP 回显响应报文与 ICMP 回显请求报文的时间差,来获得往返延时。
这个过程并不需要特殊认证,常被很多网络攻击利用,比如端口扫描工具 nmap、组包工具 hping3 等等。
为了避免这些问题,很多网络服务会把 ICMP 禁止掉,导致我们无法用 ping ,来测试网络服务的可用性和往返延时。
这时,可以用 traceroute 或 hping3 的 TCP 和 UDP 模式,来获取网络延迟。
用hping3测试TCP连通性,往返百度的时间,为31毫
hping3 -c 3 -S -p 80 www.baidu.com
HPING www.baidu.com (eth0 180.97.33.107): S set, 40 headers + 0 data bytes
len=40 ip=180.97.33.107 ttl=52 id=43290 sport=80 flags=SA seq=0 win=8192 rtt=30.8 ms
len=40 ip=180.97.33.107 ttl=52 id=2031 sport=80 flags=SA seq=1 win=8192 rtt=30.4 ms
len=40 ip=180.97.33.107 ttl=52 id=38026 sport=80 flags=SA seq=2 win=8192 rtt=33.7 ms
--- www.baidu.com hping statistic ---
3 packets transmitted, 3 packets received, 0% packet loss
round-trip min/avg/max = 30.4/31.7/33.7 ms
使用traceroute测试百度
traceroute --tcp -p 80 -n www.baidu.com
traceroute to www.baidu.com (180.97.33.107), 30 hops max, 60 byte packets
1 * * *
2 11.220.30.13 7.570 ms 8.186 ms 11.220.31.13 6.699 ms
3 * * 11.220.31.138 1.996 ms
4 11.204.180.98 4.482 ms 11.218.196.250 4.087 ms 11.204.180.122 3.793 ms
5 116.251.117.2 2.668 ms 2.618 ms 116.251.117.10 2.829 ms
6 116.251.112.157 2.898 ms 103.41.141.85 3.419 ms 116.251.112.165 3.155 ms
7 * * *
8 36.110.244.61 5.907 ms 180.149.141.117 5.921 ms 180.149.141.145 4.990 ms
9 220.181.177.77 3.651 ms 36.110.244.33 4.363 ms *
10 * * *
11 202.102.69.14 32.121 ms 202.102.69.58 37.728 ms 37.448 ms
12 * * *
13 180.97.32.102 30.030 ms 180.97.32.74 110.789 ms 180.97.32.94 30.907 ms
14 * * *
15 * * 180.97.33.107 35.010 ms
案例分析
案例中使用到的环境如下
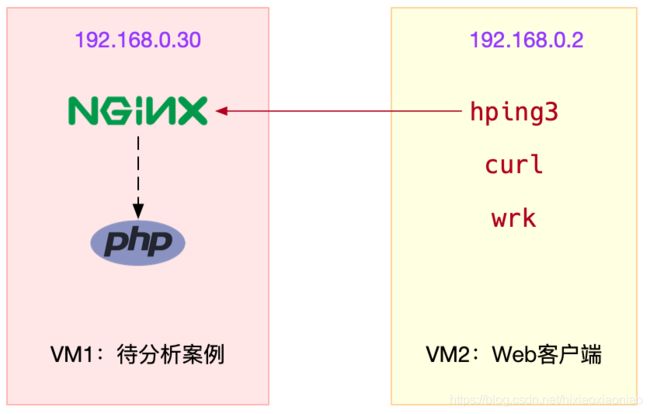
安装wrk
wget https://codeload.github.com/wg/wrk/zip/master .
unzip wrk-master.zip
cd wrk-master
yum install build-essential -y
make
cp wrk /usr/local/bin
启动一个正常的nginx
docker run --network=host --name=good -i -t -d
启动案例nginx
docker run --name nginx_test --network=host -i -t -d feisky/nginx:latency
测试两个环境的nginx返回情况
curl http://【服务端IP】:80/
。。。
Thank you for using nginx.
。。。
curl http://【服务端IP】:8080/
。。。
Thank you for using nginx.
。。。
用 wrk 测试两个服务器的并发连接性能
wrk --latency -c 100 -t 2 --timeout 2 http://【服务端ip】:80/
Running 10s test @ http://【服务端ip】:80/
2 threads and 100 connections
Thread Stats Avg Stdev Max +/- Stdev
Latency 173.32ms 296.47ms 1.94s 88.71%
Req/Sec 69.35 58.00 545.00 86.98%
Latency Distribution
50% 31.80ms
75% 265.96ms
90% 492.02ms
99% 1.61s
1355 requests in 10.01s, 1.10MB read
Socket errors: connect 0, read 0, write 0, timeout 13
Requests/sec: 135.33
Transfer/sec: 112.76KB
wrk --latency -c 100 -t 2 --timeout 2 http://【服务端ip】:8080/
Running 10s test @ http://【服务端ip】:8080/
2 threads and 100 connections
Thread Stats Avg Stdev Max +/- Stdev
Latency 269.46ms 387.81ms 1.94s 89.15%
Req/Sec 65.35 41.21 490.00 91.96%
Latency Distribution
50% 53.39ms
75% 274.77ms
90% 833.70ms
99% 1.85s
1302 requests in 10.02s, 1.07MB read
Socket errors: connect 0, read 0, write 0, timeout 28
Requests/sec: 129.94
Transfer/sec: 109.32KB
从分布上看正常的nginx 90%的请求是在492毫秒内完成的
而有问题的nginx 90%的请求是在833毫秒内完成的
抓包分析
tcpdump -nn tcp port 8080 -w nginx.pcap
再继续执行
wrk --latency -c 100 -t 2 --timeout 2 http://【服务端ip】:8080/
Running 10s test @ http://【服务端ip】:8080/
tcpdump 抓包后用Wireshark打开后分析交互过程
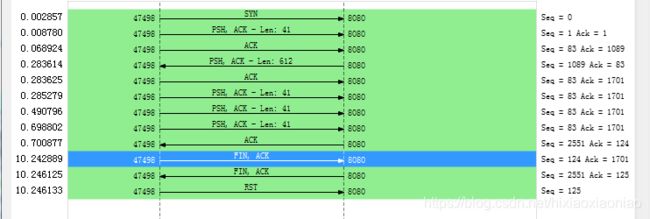
每次数据包回复都有延迟
这个跟Nagle算法有关,除非客户端开启了 TCP_QUICKACK模式,否则默认情况下采用的是 延迟确认机制
TCP_NODELAY
If set, disable the Nagle algorithm. This means that segments are always sent as soon as possible, even if there is only a small amount
of data. When not set, data is buffered until there is a sufficient amount to send out, thereby avoiding the frequent sending of small
packets, which results in poor utilization of the network. This option is overridden by TCP_CORK; however, setting this option forces
an explicit flush of pending output, even if TCP_CORK is currently set.
TCP_QUICKACK (since Linux 2.4.4)
Enable quickack mode if set or disable quickack mode if cleared. In quickack mode, acks are sent immediately, rather than delayed if
needed in accordance to normal TCP operation. This flag is not permanent, it only enables a switch to or from quickack mode. Subse-
quent operation of the TCP protocol will once again enter/leave quickack mode depending on internal protocol processing and factors such
as delayed ack timeouts occurring and data transfer. This option should not be used in code intended to be portable.
strace 分析 wrk的启动模式,是用了TCP_NODELAY,但没起开TCP_QUICKACK,所以采用的是延迟确
setsockopt(52, SOL_TCP, TCP_NODELAY, [1] 4) = 0
Nagle算法的机制如下图
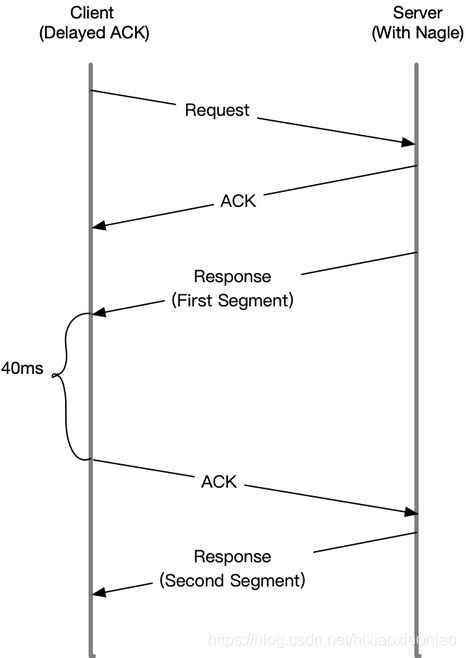
当Server发送了第一个分组后,由于Client开启了延迟确认,就需要等待40毫秒后才会回复ACK
同时,由于Server端开启了Nagle,而这时还没收到第一个分组的ACK,Server也会在这里一直等待
直到40毫秒超时后,Client才会回复ACK,然后Server才会继续发送第二个分组
查看有问题的nginx的配置情况
docker exec nginx_test cat /etc/nginx/nginx.conf | grep tcp_nodelay
tcp_nodelay off;
关闭之前有问题的,启动一个修改后的
docker run --name nginx_good --network=host -i -t -d feisky/nginx:nodelay
再用wrk检查一下,这次比上次快了
wrk --latency -c 100 -t 2 --timeout 2 http://【服务端ip】:8080/
Running 10s test @ http://【服务端ip】:8080/
2 threads and 100 connections
Thread Stats Avg Stdev Max +/- Stdev
Latency 211.41ms 332.29ms 1.98s 88.30%
Req/Sec 69.99 66.81 767.00 95.83%
Latency Distribution
50% 36.01ms
75% 272.11ms
90% 639.90ms
99% 1.61s
1366 requests in 10.02s, 1.11MB read
Socket errors: connect 0, read 0, write 0, timeout 28
Requests/sec: 136.36
Transfer/sec: 113.65KB
总结
在发现网络延迟增大后,可以调用各种工具定位网络潜在问题
使用hping3以及wrk等工具,确认单词请求和并发请求的网络延迟是否正常
使用tcpdump和Wireshark,确认网络包的收发是否正常
使用strace,观察应用程序对网络套接字的调用情况是否正常
这样,就可以依次从路由,网络包的收发,再到应用程序等,逐层排查,直到定位问题根源


 944
944

 被折叠的 条评论
为什么被折叠?
被折叠的 条评论
为什么被折叠?
 到【灌水乐园】发言


