http://msdn.microsoft.com/zh-cn/library/ms979205
注意:内容可能已经过期了。
注意:CLR Profiler最新版本:http://www.microsoft.com/download/en/details.aspx?id=16273
Analyzing Your Application's Allocation Profile
你的application profiler呈现了对象都是在那里分配的,对象的生命周期以及GC的行为。 在下面的部分,Application持有对象比需要的更长一些。这个部分采用ProfilerSample2示例。
To analyze your application's allocation profile, follow these steps:
- Run CLR Profiler on the sample application.
- Identify long-lived objects. 识别长周期对象
- Analyze GC behavior over the lifetime of your application. 分析GC在你的应用程序的生命周期中的行为
- Evaluate whether and how to reduce object lifetime. 评估能否降低对象的生命周期
Step 1. Run CLR Profiler on the Sample Application
Step 2. Identify Long-Lived Objects
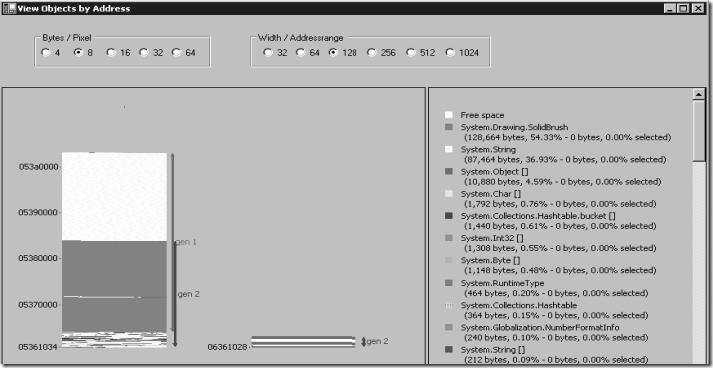
样例程序分配了100,000个SolidBrush对象,和一些字符串,最终占用了大概9M的内存。大多数的内存占用是SolidBrush对象。 通过选择Histogram Reallocated Type视图,你能够看到大概有4M的SolidBrush对象是重新分配的。这些数据表明SolidBrush对象在GC中存活下来,并且提升了一个新的代际。
为了确定这些对象的类型和使用的内存大小,点击视图菜单的Object ByAddress。
Note that generations 1 and 2 are mostly composed of SolidBrush objects.
Step 3. Analyze GC Behavior over the Lifetime of Your Application
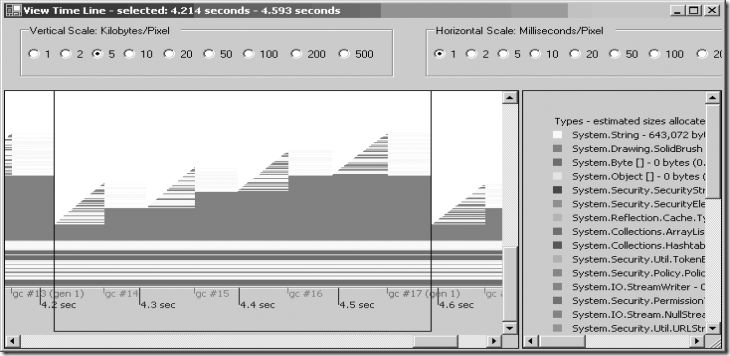
为了看得更仔细,点击Time line。 设置Vertical Scale 为5, Horizontal Scale为1,你可以看到下图:
In this figure you can see a "double sawtooth" pattern. The generation 0 collections get rid of strings but retain the brushes (in other words, the brushes survive the collections). After a while, a generation 1 collection cleans up the brushes. The double sawtooth pattern indicates that the generation 0 collections are not able to reclaim all of the memory, and objects are getting promoted which forces a higher generation collection later on.
At this point, you can see that objects are surviving the garbage collections and you need to investigate. A possible area to look at first is the SolidBrush finalizers.
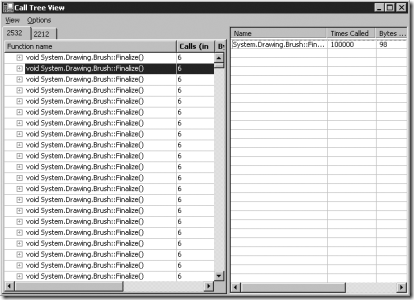
On the main menu of the tool, click Call Tree to open the call tree. To see a list of the finalizers that are called, click through the thread tabs until you find the finalizer thread.
The call tree shows that NATIVE FUNCTION (UNKNOWN ARGUMENTS) has triggered a total of 1,000,234 calls. Because the objects are not cleaned up until the finalizer thread is run, the objects are prevented from being collected and as a result are promoted. Figure 5 shows a sample call tree view window.
Step 4. Evaluate Whether and How to Reduce Object Lifetimes
Once you know which objects are long-lived, see if you can reduce their lifetimes. In this case, you simply need to make sure that SolidBrush is disposed of immediately after it is no longer needed, by wrapping it in a using block.
Sample: ProfilerSample1
ProfilerSample1 concatenates strings. The sample code for ProfilerSample1 is as follows.
ProfilerSample1.cs
using System;
public class ProfilerSample1
{
    static void Main (string[] args)
    {
        int start = Environment.TickCount;
        for (int i = 0; i < 1000; i++)
        {
            string s = "";
                for (int j = 0; j < 100; j++)
                {
                    s += "Outer index = ";
                    s += i;
                    s += " Inner index = ";
                    s += j;
                    s += " ";
                }
        }
        Console.WriteLine("Program ran for {0} seconds",
   0.001*(Environment.TickCount - start));
    }
}
Compiling the Sample
Use the following command line to compile the code.
csc.exe /t:exe ProfilerSample1.cs
Sample: ProfilerSample2
ProfilerSample2 is a simple application that allocates 100,000 SolidBrush objects and some strings. This results in a total allocation of approximately 9 MB. The sample code for ProfilerSample2 is as follows.
ProfilerSample2.cs
using System;
using System.Drawing;

public class ProfilerSample2
{
    static void Main()
    {
        int start = Environment.TickCount;
        for (int i = 0; i < 100*1000; i++)
        {
            Brush b = new SolidBrush(Color.Black);    // Brush has a finalizer
            string s = new string(' ', i % 37);

            // Do something with the brush and the string.
            // For example, draw the string with this brush - omitted...
        }
        Console.WriteLine("Program ran for {0} seconds",
                          0.001*(Environment.TickCount - start));
    }
}
Compiling the Sample
Use the following command line to compile the code.
csc.exe /t:exe ProfilerSample2.cs
Additional Resources
For more information, see the following resources:
- Chapter 4, "Architecture and Design Review of a .NET Application for Performance and Scalability"
- Chapter 5, "Improving Managed Code Performance"
- Chapter 13, "Code Review: .NET Application Performance"
- "Checklist: Managed Code Performance" in the "Checklists" section of this guide
For more information about using CLR Profiler, see the following resources:
- For detailed information about using CLR Profiler to solve common problems related to garbage collection, see "Common Garbage Collection Problems and How They are Reflected In These Views," in CLRProfiler.doc, which is located in the installation folder of the CLRProfiler.exe tool.
- To learn about the important performance factors of managed code, see MSDN article, "Writing High-Performance Managed Applications: A Primer," at http://msdn.microsoft.com/en-us/library/ms973858.aspx.
- For information about how the garbage collector works and how to optimize garbage collection, see MSDN article, "Garbage Collector Basics and Performance Hints," at http://msdn.microsoft.com/en-us/library/ms973837.aspx.
- For information about using CLR Profiler to compare and contrast the performance difference between two ways to code a solution, see the MSDN TV episode, "Profiling Managed Code with the CLR Profiler," at http://www.microsoft.com/resources/msdn/en-us/msdntv/20030729CLRGN.html.


 本文介绍如何使用CLRProfiler分析应用程序的分配概况,包括识别长寿命对象、分析垃圾回收行为及评估对象生命周期。通过示例程序展示如何减少对象生命周期。


 109
109

 被折叠的 条评论
为什么被折叠?


