Introduction
In accordance with the definition of instantaneous sound intensity as the product of the instantaneous acoustic pressure and the instantaneous particle velocity, an intensity measurement system should incorporate transducers of each of these the quantities. It is imperative that the presence of the transducers diffracts the sound field to an acceptably small degree, and that the transducer(sensor) assembly does not vibrate at audio-frequencies with a velocity amplitude comparable with the particle velocity of the acoustic field.
传感器使声场发生可接受的小角度的衍射是不可避免的,同时,相比于声场的particle velocity来说,传感器组并不会由于声音频率而发生震动。
Principles of Measurement of Sound Intensity
Sound pressure and particle velocity in a sound field can both be expressed as functions of the velocity potential of the field, but the relationship between the two depends upon the type of sound field, and is not unique. Therefore it is necessary to employ at least two sensors to determine sound intensity. Two categories of probe are in use: one with a particle velocity transduction unit, the other comprises two microphones. We shall refer to the former as a 'p-u' probe, and to the later as a 'p-p' probe, which enjoys far greater use.
The p-u principle
The p-p principle
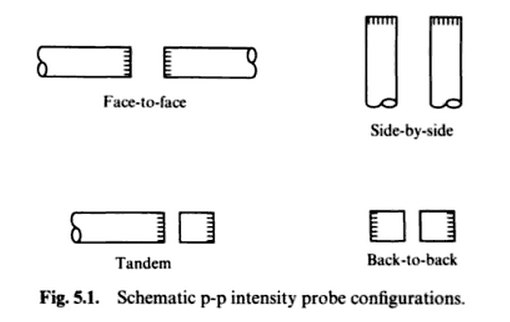
Two nominally identical pressure sensors are placed close together in a support structure which is designed to minimise diffraction of the incident sound field. Most microphone capsules take the form of short cylinders which may be associated in various configurations.
In a small amplitude sound field, the component of pressure gradient in any direction n is proportional to the component of fluid particle acceleration in that direction:
The corresponding component of particle velocity is therefore given by the time integral
This is approximated as
where d is the distance separating the acoustic centres of the transducers; this will henceforth be termed the 'separation distance'.
The pressure at the point midway between sensors is approximated as
Hence, the instantaneous intensity component is approximated by
Many sources operate steadily; their sound fields may be considered to be stationary, and for the determination of source sound power the mean intensity is of prime interest. Time stationary signals x(t) and y(t) are such that x(dx/dt) = y(dy/dt) = 0, and x(dy/dt) = -y(dx/dt). In this case, p
Frequency Distribution of Sound Intensity in Time-Stationary Sound Fields
As we have seen, the component of the instantaneous sound intensity in any particular direction is atime-dependent quantity. The expression relevant to harmonic fields.
- p-u case
‘Indirect' frequency analysis procedures are based upon Fourier (spectral) analysis of the two probe signals, which is introduced here via the correlation function which indicates the time-average relationship between two signals in the time domain. The Cross-correlation Function between the pressure and particle velocity is defined as
(Note: in the case of harmonic signals the limiting process is replaced by a time average over an integer number of cycles.)
Hence, the mean intensity component in direction r is given by
The distribution in frequency of the product of the p and u component of that frequency is given by the Fourier transform of the cross-correlation function, which is termed the Cross-spectral Density:
This function is mathematically complex. indicating the average phase relationship between p and u.
R and S form a Fourier transform pair, and thus
and
In this sense, S represents the distribution of the contributions of different frequency components of the sound field to the mean intensity.
Cross-spectra possess the following properties:
The spectral function S is defined for all positive and negative frequencies, i.e. it can be represented by pairs of counter-rotating phasors(一对旋转的矢量). For practical purposes it is convenient to redefine the spectral densities as single-sided (单面)functions of frequency, thus:
Hence, the distribution of contributions of the different frequency components to the mean intensity component is
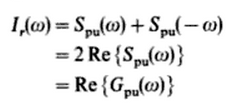
When a p-u probe is used, the equation above may be implemented directly with a two-channel FFT analyser to give I(w) in the direction of the probe axis. The total vector in a stationary field may be obtained by vector addition of the results of sequential measurements in three orthogonal directions.
The imaginary part of G(w) is proportional to the magnitude of the reactive intensity: however, unlike the real part, it does not represent the distribution of contributions of frequency components to a time-average quantity because the mean reactive intensity is zero at all frequencies. - p-p case


 本文详细阐述了声强测量的原理,包括声压和粒子速度的表达方式、传感器的作用及布置方法,以及如何通过使用两种传感器来确定声强。讨论了在小幅度声场中压力梯度和粒子加速度的关系,并解释了频率分布和时间稳定性信号中的声强成分。最后,介绍了使用FFT分析器直接实施方程的方法,以及不同探头原理在声强分析中的应用。


 1906
1906

 被折叠的 条评论
为什么被折叠?


