A=[
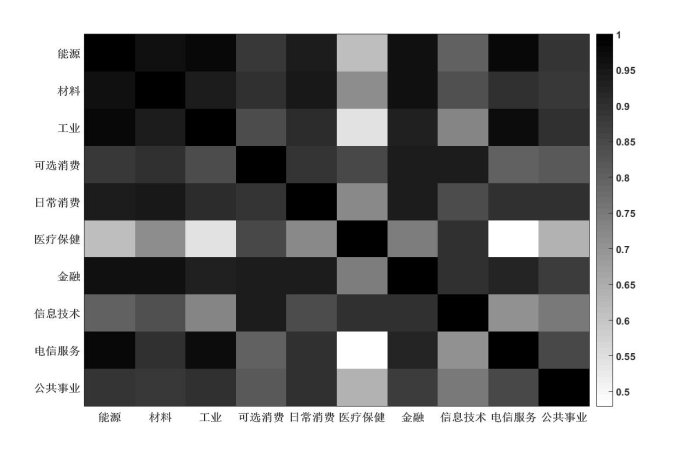
1.00 0.96 0.98 0.88 0.94 0.61 0.96 0.80 0.98 0.89
0.96 1.00 0.94 0.90 0.95 0.71 0.96 0.83 0.90 0.88
0.98 0.94 1.00 0.84 0.91 0.54 0.93 0.73 0.97 0.90
0.88 0.90 0.84 1.00 0.89 0.85 0.94 0.94 0.80 0.82
0.94 0.95 0.91 0.89 1.00 0.72 0.94 0.84 0.90 0.90
0.61 0.71 0.54 0.85 0.72 1.00 0.74 0.90 0.48 0.64
0.96 0.96 0.93 0.94 0.94 0.74 1.00 0.90 0.92 0.87
0.80 0.83 0.73 0.94 0.84 0.90 0.90 1.00 0.70 0.75
0.98 0.90 0.97 0.80 0.90 0.48 0.92 0.70 1.00 0.85
0.89 0.88 0.90 0.82 0.90 0.64 0.87 0.75 0.85 1.00];
mat = A; %# A n-by-n matrix of random values from 0 to 1
imagesc(mat); %# Create a colored plot of the matrix values
colormap(flipud(gray)); %# Change the colormap to gray (so higher values are
%# black and lower values are white)
textStrings = num2str(mat(:),'%0.2f'); %# Create strings from the matrix values
textStrings = strtrim(cellstr(textStrings)); %# Remove any space padding
[x,y] = meshgrid(1:10); %# Create x and y coordinates for the strings,it should be set based on the number of labels.
hStrings = text(x(:),y(:),textStrings(:),... %# Plot the strings
'HorizontalAlignment','center');
midValue = mean(get(gca,'CLim')); %# Get the middle value of the color range
set(gca,'XTick',1:10,... %# Change the axes tick marks
'XTickLabel',{'能源','材料','工业','可选消费','日常消费','医疗保健','金融','信息技术','电信服务','公共事业'},... %# and tick labels
'YTick',1:10,...
'YTickLabel',{'能源','材料','工业','可选消费','日常消费','医疗保健','金融','信息技术','电信服务','公共事业'},...
'TickLength',[0 0]);
[x,y] = meshgrid(1:10); %# Create x and y coordinates for the strings
hStrings = text(x(:),y(:),textStrings(:),... %# Plot the strings
'HorizontalAlignment','center');
midValue = mean(get(gca,'CLim')); %# Get the middle value of the color range
textColors = repmat(mat(:) > midValue,1,3); %# Choose white or black for the
%# text color of the strings so
%# they can be easily seen over
%# the background color
set(hStrings,{'Color'},num2cell(textColors,2)); %# Change the text colors


 本文介绍了一种使用MATLAB对随机生成的10x10矩阵进行可视化的方法,并展示了如何通过颜色映射和文本标注来清晰地展示数据。矩阵中的元素代表了不同行业之间的相似度,通过对数值的颜色编码和直接标注,使得数据的解读更加直观。


 8206
8206

 被折叠的 条评论
为什么被折叠?
被折叠的 条评论
为什么被折叠?
 到【灌水乐园】发言


