


 本文介绍了使用MNIST数据集进行计算机视觉的基础知识,通过链接原文深入探讨了如何利用MNIST进行2D图像识别。
mnist.mnist
介绍(Introduction)
The MNIST database of handwritten digits is a great repository for computer vision and machine learning projects. It contains 60,000 training images and 10,000 testing images of handwritten digits from 0 to 9.
MNIST手写数字数据库是计算机视觉和机器学习项目的理想存储库。 它包含60,000个训练图像和10,000个手写数字的测试图像,范围从0到9。
你会学什么? (What will you learn?)
You will take the first steps to the computer vision world. You will also configure your first Neural Network. You will also try to optimise our Neural Network by changing the number of layers and nodes, experimenting with the layer activation function and other parameters. You will use Keras/Tensorflow for this exercise.
您将迈向计算机视觉世界的第一步。 您还将配置您的第一个神经网络。 您还将尝试通过更改层和节点的数量,尝试层激活功能和其他参数来优化我们的神经网络。 您将在此练习中使用Keras / Tensorflow。
问题定义 (Problem definition)
Our goal is to recognise, using computer vision, graphics of handwritten digits.
我们的目标是使用计算机视觉识别手写数字的图形。
We will use a simple Neural Network to start with and then we will use optimisation techniques to achieve better results.
我们将首先使用简单的神经网络,然后使用优化技术来获得更好的结果。
逐步解决方案 (Step by step solution)
Create a project folder
创建一个项目文件夹
Create a folder for a project on your computer called “Neural-Networks-Keras-MNIST”
在计算机上为项目创建一个名为“ Neural-Networks-Keras-MNIST”的文件夹
Start a new notebook
启动新笔记本
Open the folder in your Terminal/Command Prompt and start Jupyter Notebook by typing the command:
在终端/命令提示符中打开文件夹,然后通过键入以下命令启动Jupyter Notebook:
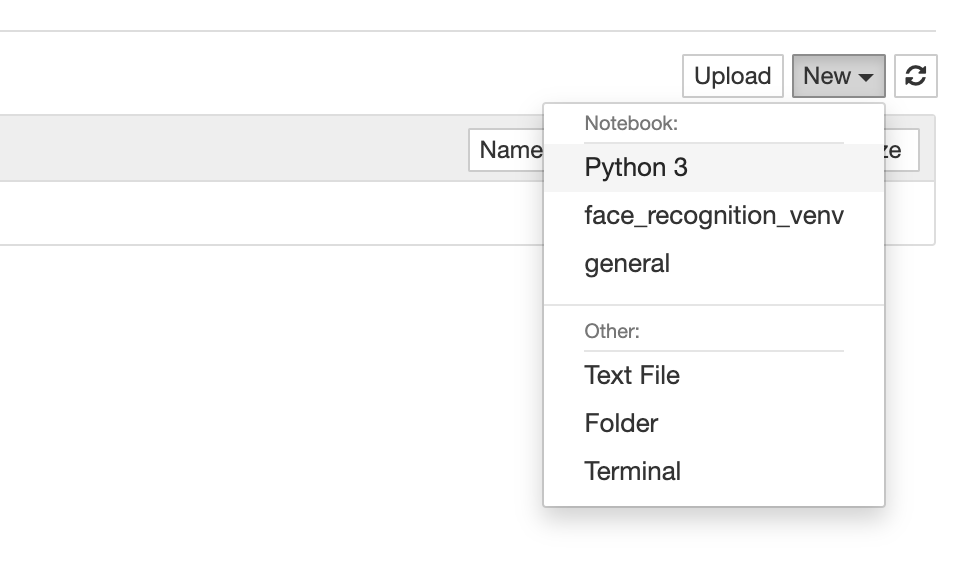
$ jupyter notebookClick new in the top right corner and select Python 3.
单击右上角的“新建”,然后选择“ Python 3”。
This will open a new Jupyter Notebook window in your browser. Rename the Untitled project name to your project name and you are ready to start.
这将在浏览器中打开一个新的Jupyter Notebook窗口。 将Untitled项目名称重命名为您的项目名称,您就可以开始了。
If you have Anaconda installed on your computer you should already have all libraries needed for this project installed on your computer.
如果您的计算机上安装了Anaconda,则应该已经在计算机上安装了该项目所需的所有库。
In case you receive an error of a missing library you can use pip3 or conda to install a missing library.
如果你收到你可以使用PIP 3或畅达安装缺少的库缺少库的错误。
There are two ways you can install a new library. Open Terminal/Command Prompt and type:
有两种安装新库的方法。 打开终端/命令提示符,然后键入:
pip3 install mnistor
要么
conda install mnistYou can use these commands for any missing libraries. For example mnist, keras, tensorflow.
您可以对所有缺少的库使用这些命令。 例如mnist,keras,tensorflow 。
If you are using Google Colab, open a new notebook.
如果您使用的是Google Colab ,请打开一个新笔记本。
加载库和设置 (Loading libraries & Setup)
Importing Numpy, MNIST, Keras and Matplotlib.
导入Numpy,MNIST,Keras和Matplotlib。
# NumPy - mathematical functions on multi-dimensional arrays and matrices
import numpy as np
# MNIST - digital database of handwritten digits
import mnist


# Matplotlib - plotting library to create graphs and charts
import matplotlib.pyplot as plt


# Keras - Python open-source neural-network library
from keras.models import Sequential
from keras.layers import Dense
from keras.utils import to_categorical准备训练数据(Preparing training data)
Importing train and test images from MNIST. Keeping original images to display some digits initially and during testing.
从MNIST导入训练和测试图像。 保留原始图像以在开始时和测试期间显示一些数字。
train_images = mnist.train_images()
train_labels = mnist.train_labels()
Let’s look at the shape of the data
让我们看一下数据的形状
train_images.shape(60000, 28, 28) # OutputWe have 60000 images and the size of each image is 28 x 28 pixels, represented as 28 by 28 matrix of numbers.
我们有60000张图像,每个图像的大小为28 x 28像素,用28 x 28的数字矩阵表示。
Before we normalise our training data let’s grab some images for display.
在标准化训练数据之前,我们先获取一些图像进行显示。
train_images_display = train_images[:5]Let’s normalise and flatten our training images data. This is a better format to use for our Neural Network training.
让我们归一化和展平我们的训练图像数据。 这是用于我们的神经网络培训的更好格式。
# Normalize the images.
train_images = (train_images / 255) - 0.5


# Flatten the images - changing the dimension of the array from 28 x 28 to 1 x 784.
train_images = train_images.reshape((-1, 784))


print('Our training array has a shape ' + str(train_images.shape))
print('Each element (image) has a shape ' + str(train_images[0].shape))
# Output
Our training array has a shape (60000, 784)
Each element (image) has a shape (784,让我们打印一些数字 (Let’s print some digits)
Printing some digits using Matplotlib.
使用Matplotlib打印一些数字。
# Display images (optional step) - it takes a lot of memory so skip if you want
f = plt.figure(figsize=(10,5))
columns = 5
images = train_images_display[:20]
for i, image in enumerate(images):
    plt.subplot(len(images) / columns + 1, columns, i + 1)
    # imshow displays array-like images
    plt.imshow(image)


plt.show()
f.clear()
plt.close(f)建立模型(Building the model)
Creating an Artificial Neural Network model with Keras. Our Neural Network has 1 input layer, 1 hidden layer, and 1 output layer.
使用Keras创建人工神经网络模型。 我们的神经网络有1个输入层,1个隐藏层和1个输出层。
We are creating our model which groups layers into an object. The sequential model is suitable for most problems. It does not allow you to create models that share layers or have multiple inputs or outputs.
我们正在创建将图层分组为对象的模型。 顺序模型适用于大多数问题。 它不允许您创建共享图层或具有多个输入或输出的模型。
We are using Dense layers in our NN which are regular densely-connected NN layers. Densely-connected means that each neuron in a layer receives input from all the neurons in the previous layer.
我们在NN中使用密集层,它们是规则的密集连接的NN层。 紧密连接意味着层中的每个神经元都从上一层中的所有神经元接收输入。
The input_shape specifies the dimension of the input data. In our example, it is an image 28 by 28 pixels that we have flattened to (784,).
input_shape指定输入数据的维度。 在我们的示例中,这是一张我们平展为(784,)的28 x 28像素的图像。
The output layer has to have the same number of nodes as we expect results. In our example, we are expecting a result from 0 to 9 which means we need 10 nodes in the output.
输出层必须具有与预期结果相同数量的节点。 在我们的示例中,我们期望结果为0到9,这意味着我们需要在输出中包含10个节点。
We are using a softmax activation function for the output that converts a real vector to a vector of categorical probabilities. The elements of the output vector are in range (0, 1).
我们将softmax激活函数用于输出,该函数将实向量转换为分类概率向量。 输出向量的元素在(0,1)范围内。
How are we going to get a result from 0 to 9?. We will convert our labels during training to an array using Keras to_categorical function and our output from Neural Network will be in the same format.
我们如何得到0到9的结果? 我们将在训练过程中使用Keras to_categorical函数将标签转换为数组,并且神经网络的输出将采用相同的格式。
This means that 1 for example will be represented as [0., 1., 0., 0., 0., 0., 0., 0., 0., 0.], 2 will be represented as [0., 0., 1., 0., 0., 0., 0., 0., 0., 0.] and our results for each digits will look like this [1.9625609e-06 6.5977215e-09 1.7479050e-04 2.1603969e-03 1.0921193e-08 1.1998044e-05 9.2225836e-12 9.9754709e-01 2.6972772e-05 7.6780409e-05] which will give us probabilities which number is the most probable result.
这意味着例如1将表示为[0.,1.,0.,0.,0.,0.,0.,0.,0.,0。],2将表示为[0。 ,0.,1.,0.,0.,0.,0.,0.,0.,0.],我们每个数字的结果将像这样[1.9625609e-06 6.5977215e-09 1.7479050e- 04 2.1603969e-03 1.0921193e-08 1.1998044e-05 9.2225836e-12 9.9754709e-01 2.6972772e-05 7.6780409e-05]这将为我们提供最大可能结果的概率。
Other layers in our Neural Network use ReLU activation function. ReLU is the most commonly used activation function in Neural Networks. You can experiment and learn more about different activation functions on Keras documentation (https://keras.io/api/layers/activations/).
神经网络中的其他层使用ReLU激活功能。 ReLU是神经网络中最常用的激活功能。 您可以尝试并在Keras文档( https://keras.io/api/layers/activations/ )上了解有关不同激活功能的更多信息。
model = Sequential([
  Dense(64, activation='relu', input_shape=(784,)),
  Dense(64, activation='relu'),
  Dense(10, activation='softmax'),
])编译模型(Compiling the Model)
Once the model is created we need to compile it. We need to specify two required arguments: optimizer and loss function.
创建模型后,我们需要对其进行编译。 我们需要指定两个必需的参数:优化器和损失函数。
The optimizer is an optimization algorithm that is used to optimize the training process and adjust the weights on the nodes that lead towards a solution. We will use optimizer that implements the Adam algorithm. Adam is a stochastic gradient descent method (https://keras.io/api/optimizers/adam/) and it is probably the most popular optimizer and it usually performs well.
优化器是一种优化算法,用于优化训练过程并调整导致解决方案的节点上的权重。 我们将使用实现Adam算法的优化器。 Adam是一种随机梯度下降方法( https://keras.io/api/optimizers/adam/ ),它可能是最受欢迎的优化器,并且通常表现良好。
Loss function computes the quantity that a model should aim to minimize during training (https://keras.io/api/losses/). We will be using categorical_crossentropy function.
损失函数计算模型在训练过程中应尽量减少的数量( https://keras.io/api/losses/ )。 我们将使用categorical_crossentropy函数。
We are also specifying metrics that are displayed during calling fit() function and training our model. In our project, we will use “accuracy” to see how the accuracy changes after each Epoch.
我们还将指定在调用fit()函数和训练模型期间显示的指标。 在我们的项目中,我们将使用“准确性”来查看每个纪元后准确性如何变化。
model.compile(
  optimizer='adam',
  loss='categorical_crossentropy',
  metrics=['accuracy'],
)训练模型(Training the model)
We will be now training our model using model.fit() function.
现在,我们将使用model.fit()函数训练模型。
We provide train images to the function and the labels. Labels (dependant variables) are converted from a vector (integer) to a binary class matrix. Epoch is one pass over the entire dataset and batch_size is the number of images train during one pass through a Neural Network. You can experiment with the number of epochs and batch size to optimise training results.
我们为功能和标签提供火车图像。 标签(因变量)从向量(整数)转换为二进制类矩阵。 时期是整个数据集的一遍,而batch_size是一次通过神经网络时训练的图像数量。 您可以试验时期数和批量大小以优化训练结果。
model.fit(
  train_images, # training data
  to_categorical(train_labels), # training targets
  epochs=5,
  batch_size=32,
)保存模型(Saving the model)
Once our model is trained we can save it to a file.
训练完模型后,我们可以将其保存到文件中。
model.save_weights('model.h5')加载模型(Loading the model)
Saving a model enables us to just load the model without the need of it being train again.
保存模型可以使我们仅加载模型,而无需再次训练。
In our project, we can train the model quickly but the training of a complex Neural Network models can take hours or days and saving a model is a useful thing to do.
在我们的项目中,我们可以快速训练模型,但是训练复杂的神经网络模型可能要花费数小时或数天,保存模型是一件有用的事情。
# Load the model's saved weights.
model.load_weights('model.h5')准备测试数据(Preparing testing data)
Let’s prepare some testing data so we can test the performance of our model.
让我们准备一些测试数据,以便我们可以测试模型的性能。
We take test images and labels from the MNIST library, normalize the test images values for better model performance and flatten the images.
我们从MNIST库中获取测试图像和标签,对测试图像值进行标准化以提高模型性能,并展平图像。
test_images = mnist.test_images()
test_labels = mnist.test_labels()


# Normalize the images.
test_images = (test_images / 255) - 0.5


# Flatten the images.
test_images = test_images.reshape((-1, 784))测试模型(Testing the model)
Here we are putting our models to the test.
在这里,我们对模型进行测试。
result = model.evaluate(
  test_images,
  to_categorical(test_labels)
)


print(model.metrics_names[0] + ': ' + str(result[0]))
print(model.metrics_names[1] + ': ' + str(result[1]))
# Output
10000/10000 [==============================] - 0s 39us/step
loss: 0.10312977911322378
accuracy: 0.9657999873161316If the results are not satisfactory we can go back and reconfigure our Network and increase the number of layers or nodes.
如果结果不令人满意,我们可以返回并重新配置我们的网络并增加层数或节点数。
We can also go back to the training and model.fit() function and change the number of epochs or batch_size and see if we get better results.
我们还可以返回到training和model.fit()函数,并更改纪元数或batch_size ,看看是否能获得更好的结果。
做出预测 (Making predictions)
Finally, let’s make some predictions using the first five elements of the testing data.
最后,让我们使用测试数据的前五个元素进行一些预测。
# Predict on the first 5 test images.
predictions = model.predict(test_images[:5])


# Print our model's predictions.
print(np.argmax(predictions, axis=1)) # [7, 2, 1, 0, 4]


# Check our predictions against the ground truths.
print(test_labels[:5]) # [7, 2, 1, 0, 4]
As we can see even with a simple Neural Network we receive very good accuracy of approx. 0.9667.
如我们所见,即使使用简单的神经网络,我们也能获得大约2,000的非常好的精度。 0.9667 。
I encourage you to experiment further with this example and try to achieve better results by changing the structure of the Neural Network, experiment with activation layers etc.
我鼓励您进一步尝试该示例,并尝试通过更改神经网络的结构,使用激活层等来获得更好的结果。
I hope this example with MNIST has shown you how well Neural Networks work in Computer Vision tasks.
我希望MNIST的这个示例向您展示了神经网络在计算机视觉任务中的工作情况。
If you would like to learn more and experiment with Python and Data Science you can look at another of my articles Analysing Pharmaceutical Sales Data in Python.
如果您想了解更多信息并尝试使用Python和数据科学,则可以查看我的另一篇文章《使用Python分析药品销售数据》 。
To consolidate your knowledge consider completing the task again from the beginning without looking at the code examples and see what results you will get. This is an excellent thing to do to solidify your knowledge.
为了巩固您的知识,请考虑从头开始再次完成任务,而无需查看代码示例,也不看将得到什么结果。 巩固您的知识是一件很棒的事情。
Full Python code in Jupyter Notebook is available on GitHub:https://github.com/pjonline/Basic-Data-Science-Projects/tree/master/3-Introduction-to-Computer-Vision-with-MNIST
GitHub上提供了Jupyter Notebook中的完整Python代码: https : //github.com/pjonline/Basic-Data-Science-Projects/tree/master/3-Introduction-to-Computer-Vision-with-MNIST
Happy coding!
编码愉快!
翻译自: https://medium.com/@pjarz/introduction-to-computer-vision-with-mnist-2d31c6f4d9a6
mnist.mnist


 382
382

 被折叠的 条评论
为什么被折叠?
被折叠的 条评论
为什么被折叠?
 到【灌水乐园】发言


