


 二项分布是一种离散分布,用于描述成功或失败的事件,如考试的通过/失败或硬币的正反面。它与正态分布不同,但在大量数据时,二项分布趋向于正态分布的行为。本文将探讨二项分布的图形表示及与正态分布的比较,并介绍其数学公式和参数。
二项分布(Binomial Distribution)
What is Binomial Distribution ?
什么是二项分布?
It is a discrete distribution and describes success or failure of an event. e.g:- In an examination student can either pass or fail , if a coin is tossed it gives either head or tail. In other word Binomial Distribution deals with only two possible outcomes.
它是离散分布,描述事件的成功或失败。 例如:-在考试中,学生可以通过或不通过,如果掷硬币,则正面或反面都可以。 换句话说,二项分布只处理两个可能的结果。
Difference between Binomial Distribution and normal Distribution ?
二项分布与正态分布之间的区别?
Binomial Distribution is Discrete whereas Normal Distribution is continious in nature but for a large datapoints Binomial Distribution predominantly behaves like Normal Distribution.
二项分布是离散的,而正态分布在本质上是连续的,但对于较大的数据点,二项分布的行为主要类似于正态分布。
pictorial representation
图形表示
import numpy as np   #Binomial Distribution plot
import matplotlib.pyplot as plt
import seaborn as sns
binomial_data=np.random.binomial(n=10,p=0.3,size=1000)
sns.distplot(binomial_data,kde=True,hist=True,color="green")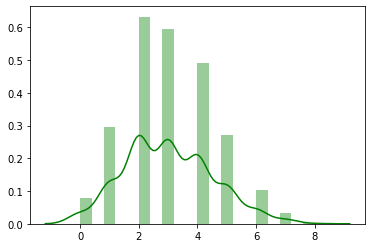
comparison between binomial and normal distriburtion
二项分布与正态分布的比较
import numpy as np
import matplotlib.pyplot as plt
import seaborn as sns
sns.distplot(np.random.binomial(n=100,p=0.3,size=100),hist=False,kde=True,color="green",label="Binomial")
sns.distplot(np.random.normal(loc=30,scale=5,size=100),hist=False,kde=True,color="red",label="Normal")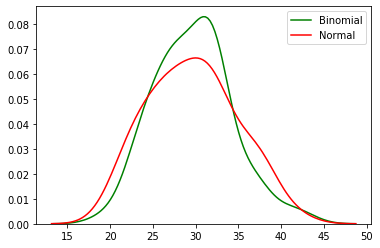
Mathematical formulation and Parameters of Binomial Distribution(n,p,size,x)
二项分布(n,p,size,x)的数学公式和参数
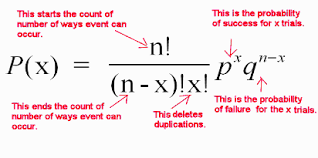
Parameters P,Q,n,x can be defined in next subsection with the help of an example.
参数P,Q,n,x可以在下一节中借助示例进行定义。
Q 1.> A company manufactures LED bulbs with a faulty rate of 30%. If I randomly select 6 chosen LEDs, what is the probability of having 2 faulty LEDs in my sample? Calculate the average value of this process. Also evaluate the standard deviation associated with it ?
问1.>一家公司生产的LED灯泡的故障率为30%。 如果我随机选择6个LED,样本中有2个故障LED的概率是多少? 计算此过程的平均值。 还评估与之相关的标准偏差吗?
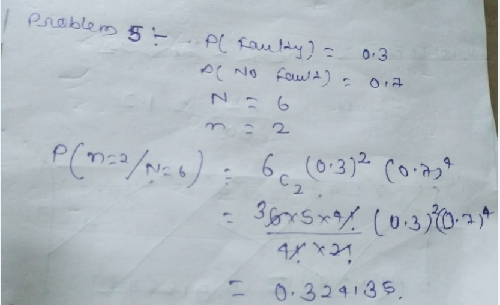
Defining parameters;
定义参数;
P=0.3     ;   Q=1-P=0.7
n=total number of trials=6
k=number of trail that will be successed=2
size=Total number of random samples =1000
Mathematical Calculation :-
数学计算:
why we take random samples(z) ?
为什么我们要抽取随机样本(z)?
When we analyse data as a M.L engineer we must ensure how the uncertanity introduced by random samples affects our datasets .We also try to evaluate how data would be affected by random error.
当我们以ML工程师的身份分析数据时,必须确保随机样本引入的不可靠性如何影响我们的数据集。我们还尝试评估随机误差将如何影响数据。
Python implementation and plotting
Python实现和绘图
from scipy.stats import binom
import matplotlib.pyplot as plt
import seaborn as sns
binomial_data=binom.rvs(n=6,p=0.3,size=1000)
sns.distplot(binomial_data,hist=True,kde=True,color="red")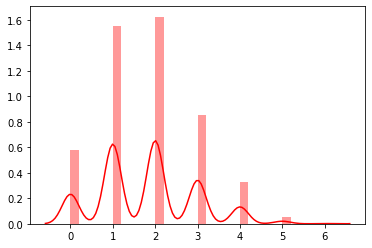
#Probability of getting faulty out of 6 trials
from scipy.stats import binom
import matplotlib.pyplot as plt
import seaborn as sns
probab=binom.pmf(k=2,n=6,p=0.3)
print("Probability will be :",probab)
cdf=binom.cdf(k=2,n=6,p=0.3)
print("CDF will be :",cdf)[out]>> Probability will be : 0.32413499999999995
        CDF will be : 0.74431
Now I will calculate mean and standard deviation;
现在,我将计算均值和标准差;
mean=np & standard deviation=sqrt(npq)
平均值= np和标准偏差= sqrt(npq)
import scipy.stats as binom
import math
mean,var=binon.stats(n=6,p=0.3)
print("mean := ',mean)
print("standard deviation :=",math.sqrt(var))[out]>>mean :=  1.7999999999999998
standard deviation := 1.1224972160321822
泊松分布 (Poisson Distribution)
What is poisson distribution ?
什么是泊松分布?
It describe the distribution of rare event in a given population.It is mainly used for forecasting eg:- how many pligrims have been visited to vaishno devi during covid-19 pandemic etc.
它描述了给定人群中稀有事件的分布,主要用于预测例如:-在covid-19大流行等期间曾拜访过vaishno devi的朝圣者。
How to decide when to use binomial or Poisson ?
如何决定何时使用二项式或泊松?

i. > Suppose you have given average number of probability per unit time and you have to find certain number of probability for a particular time then poisson is used.
一世。 >假设您给出了每单位时间的平均概率数,并且必须找到特定时间的一定概率数,然后使用泊松法。
ii.> If you have given exact probability and need to find out probability happening certain number of time out of 10 times, 100 times etc.
ii。>如果您已经给出了确切的概率,并且需要找出概率发生在10次,100次等中的一定次数,
Mathematical formulation and parametric understanding
数学公式化和参数理解
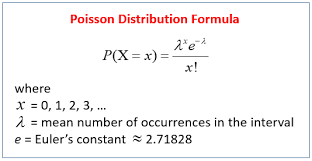
lambda:- mean number of occurances in the interval.
lambda:-间隔中的平均发生次数。
x/k:-number of success we are interested in
x / k:-我们感兴趣的成功次数
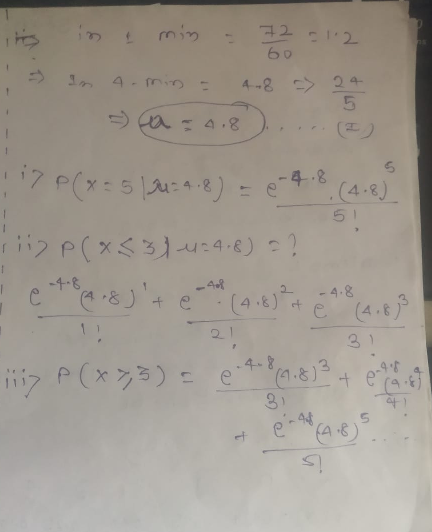
Q..>Customers arrive at a rate of 72 per hour to my shop. What is the probability of 𝑘 customers arriving in 4 minutes? a) 5 customers, b) not more than 3 customers.
问:>顾客到我店的速度是每小时72个。 𝑘客户在4分钟内到达的概率是多少? a)5个客户,b)不超过3个客户。
sol:- customer arrive per minute=72/60=1.2 then, in 4 min total number of customer will arrive =1.2 X 4=4.8
sol:-客户每分钟到达= 72/60 = 1.2,那么,在4分钟内客户总数将到达= 1.2 X 4 = 4.8
now applying poisson formula we will get;
现在应用泊松公式,我们将得到:
pictorial presentation using python
使用python的图片演示
from scipy.stats import poisson
import matplotlib.pyplot as plt
import seaborn as sns
poisson_data=poisson.rvs(mu=4.8,size=1000)
sns.distplot(poisson_data,hist=True,kde=True,color="red")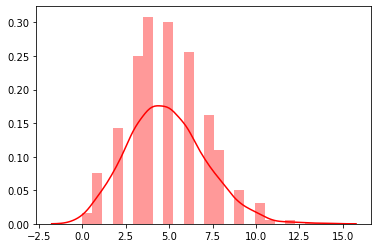
from scipy.stats import poisson
probab1=poisson.pmf(k=5,mu=4.8)
probab2=sum(poisson.pmf(k=[0,1,2],mu=4.8))
print(probab1,probab2)[out]>> 0.17474768364388296 0.14253921888902693
翻译自: https://medium.com/@akhilanandkspa/binomial-and-poisson-distribution-337958a384f3


 234
234

 被折叠的 条评论
为什么被折叠?
被折叠的 条评论
为什么被折叠?
 到【灌水乐园】发言


