


 本教程展示了如何使用Python的Matplotlib和Pandas库创建实时更新的图形,适用于实时数据可视化,如传感器数据或股票价格跟踪。通过FuncAnimation方法不断更新图形,并模拟实时数据流,即使CSV文件中有新数据也能正常工作。
The goal of this guide is to show you how to update a graph in real-time. This can be used for a variety of applications like visualizing live data from sensors or tracking stock prices.
本指南的目的是向您展示如何实时更新图形 。 这可用于多种应用程序,例如可视化传感器的实时数据或跟踪股票价格。
In this tutorial, the data will be static but can easily be used on live data. You’ll, of course, need to have MatPlotlib and Pandas installed on your local machine or virtual environment.
在本教程中,数据将是静态的,但可以轻松地用于实时数据。 当然,您需要在本地计算机或虚拟环境上安装MatPlotlib和Pandas 。

进口货 (Imports)
import matplotlib.pyplot as plt
from matplotlib.animation import FuncAnimation
import pandas as pd‘FuncAnimation’ is the method that we’ll be using to update the graph continuously giving it that live effect.
“ FuncAnimation ”是我们将用来不断更新图形的方法,以使其具有实时效果。
We will be using MatPlotLib in this tutorial to generate our graphs and the panda's library to read CSV files.
在本教程中,我们将使用MatPlotLib生成图形,并使用熊猫的库读取CSV文件。
初始化子图 (Initialize the subplot)
plt.style.use('seaborn')
fig = plt.figure()
ax = fig.add_subplot(1,1,1)
We’re going to create a subplot to make it easier for us to draw on the same plot over and over again.
我们将创建一个子图,以使我们可以更轻松地反复绘制同一图。
创建动画方法 (Creating the Animation Method)
def animation(i):
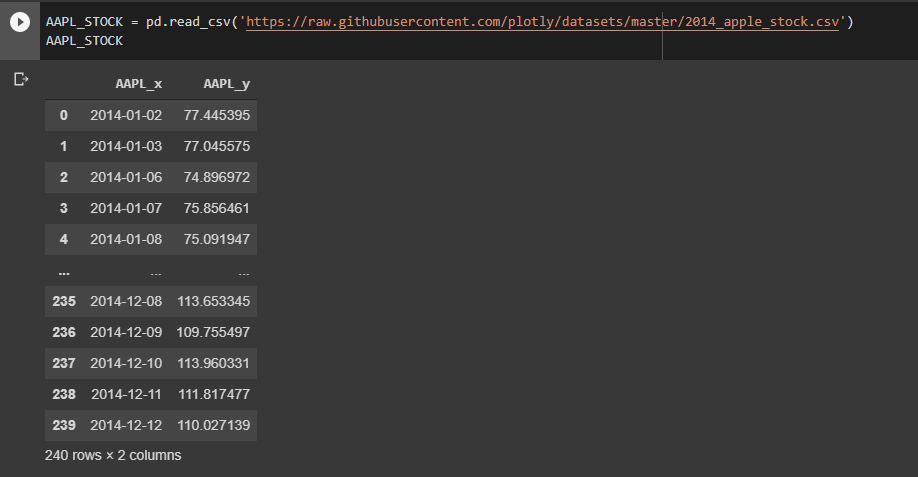
AAPL_STOCK = pd.read_csv('https://raw.githubusercontent.com/plotly/datasets/master/2014_apple_stock.csv')
x = []
y = []
x = AAPL_STOCK[0:i]['AAPL_x']
y = AAPL_STOCK[0:i]['AAPL_y']
ax.clear()
ax.plot(x, y)The animation(i) method is what we’ll use to draw our line over and over again. This method will be called by the FuncAnimation method from the MatPlotLib library over and over again until you decide to terminate the program.
animation(i)方法是我们用来一遍又一遍地画线的方法。 该方法将由MatPlotLib库中的FuncAnimation方法反复调用,直到您决定终止程序为止。
In this example, I’ll be using a static file pulled off the internet. This file gives us the 2014 stock price for Apple.
在此示例中,我将使用从Internet提取的静态文件。 该文件为我们提供了苹果2014年的股价。
Here’s how our dummy data will look:
这是我们的虚拟数据的外观:
Now to mimick live data instead of plotting the whole graph in one go, what I’ll instead do is plot each row. This gives us the illusionary live data.
现在要模拟实时数据,而不是一次性绘制整个图形,我要做的是绘制每一行。 这给了我们虚幻的实时数据。
Remember that the animation(i) function will be called every iteration. Each time its called i goes up by one. This line, AAPL_STOCK[0:i]['AAPL_x'] , will return the rows corresponding to the iteration we’re on.
请记住, animation(i)函数将在每次迭代时调用 。 每当它叫i上升一。 该行AAPL_STOCK[0:i]['AAPL_x']将返回与我们AAPL_STOCK[0:i]['AAPL_x']的迭代相对应的行。
For example, on iteration 1 we will return the just the first row in the dataset. On the nth iteration, we will return the nth row (and all rows before it) in the dataset.
例如,在迭代1中,我们将仅返回数据集中的第一行。 在第n次迭代中,我们将返回数据集中的第n行(及其之前的所有行)。
To draw the line to the graph, we just need to call ax.plot(x,y). We also call ax.clear() to clear the line generated before. We do this to not draw lines over each other after each iteration.
要将线绘制到图形上,我们只需要调用ax.plot(x,y) 。 我们还调用ax.clear()清除之前生成的行。 我们这样做是为了在每次迭代后都不会在彼此之间画线。

为什么要循环导入数据集? (Why Import the dataset in a loop?)
You may have noticed that we read the CSV in our loop. The reason we need to do this is that if new data was added to the CSV we could read it and draw it to our graph.
您可能已经注意到,我们在循环中读取了CSV。 我们需要这样做的原因是,如果将新数据添加到CSV,我们可以读取它并将其绘制到图形中。
如果我想使用文本文件怎么办? (What if I wanted to use a text file instead?)
If you were using a text file instead, you could append values to x and y at each iteration. For example:
如果使用的是文本文件,则可以在每次迭代时将值附加到x和y上。 例如:
def animation(i):
  x = []
  y = []
  txt_data = open('data.txt','r').read() # Get Your Data From txt
  rows = data.split('\n')                # Split all the rows into a List
  for row in rows:                       # Iterate through the List
      x_data, y_data = line.split(',')
      x.append(x_data)
      y.append(y_data)
  ax.clear()
  ax.plot()
运行动画 (Running the animation)
To run the animation we just need to use the following.
要运行动画,我们只需要使用以下内容。
animation = FuncAnimation(fig, func=animation, interval=1000)plt.show()Here, the `FuncAnimation` will continuously run our animation program. interval is used to determine the delay between updates. Currently, its set to 1000 milliseconds but it can be as fast or as slow as you need it to be.
在这里,` FuncAnimation`将连续运行我们的动画程序。 interval用于确定更新之间的延迟。 当前,它设置为1000毫秒,但可以根据需要设置其速度或速度。

Here’s all the code:
这是所有代码:
import matplotlib.pyplot as plt
from matplotlib.animation import FuncAnimation
import pandas as pd


plt.style.use('seaborn')
fig = plt.figure()
ax = fig.add_subplot(1,1,1)


def animation(i):
  AAPL_STOCK = pd.read_csv('https://raw.githubusercontent.com/plotly/datasets/master/2014_apple_stock.csv')
  x = []
  y = []


  x = AAPL_STOCK[0:i]['AAPL_x']
  y = AAPL_STOCK[0:i]['AAPL_y']


  ax.clear()
  ax.plot(x, y)


animation = FuncAnimation(fig, func=animation, interval=1000)
plt.show()
它真的可以与添加的新值一起工作吗? (Does it really work with new values being added to it?)
So, here I just removed some data from the CSV we were working with above.
因此,这里我只是从上面使用的CSV中删除了一些数据。
Then once the graph updated to the end of the dataset I copied in some new data and saved the file. The graph then updated with all the new data that I just added. In this case, it updated pretty quickly but only cause the interval time was set to 100ms.
然后,一旦图形更新到数据集的末尾,我就复制了一些新数据并保存了文件。 然后,该图使用我刚刚添加的所有新数据进行了更新。 在这种情况下,它更新非常快,但是仅导致间隔时间设置为100ms 。

If you liked this guide you can check out some other cool articles if written below! If you have any questions feel free to leave a comment and I can try and help you out.
如果您喜欢本指南,则可以阅读下面写的其他一些很棒的文章 ! 如果您有任何疑问,请随时发表评论,我会尽力帮助您。
翻译自: https://towardsdatascience.com/animate-data-using-python-dd558e9103d


 被折叠的 条评论
为什么被折叠?
被折叠的 条评论
为什么被折叠?
 到【灌水乐园】发言


