


 本教程引导读者免费设置BigQuery沙盒,利用内置的GIS功能处理和分析地理空间数据。通过实例展示了如何使用BigQuery进行空间连接,查询公开数据集,并通过BigQuery Geo Viz工具进行可视化。
Cloud computing in this era of big data is ubiquitous. However, many cloud services do not provide a location component to analyze and visualize geospatial data. Big Query, has built-in capabilities to ingest, process and analyze geospatial data.
在大数据时代,云计算无处不在。 但是,许多云服务没有提供位置组件来分析和可视化地理空间数据。 Big Query具有内置功能,可以提取,处理和分析地理空间数据。
In this tutorial, I will guide you through setting BigQuery Sandbox for free, processing spatial data with familiar PostGIS/Spatial SQL interface and visualize it right in the cloud.
在本教程中,我将指导您免费设置BigQuery Sandbox,使用熟悉的PostGIS / Spatial SQL界面处理空间数据,并在云中对其进行可视化显示。
设置免费的BigQuery沙盒 (Set up Free BigQuery Sandbox)
Google generously offers a free sandbox which you can experiment. The BigQuery Sandbox gives you free access to try and experiment BigQuery functionalities with some limits. With the Sandbox, you can use BigQuery without creating a billing account or enabling billing for your project.
Google慷慨地提供了一个免费的沙箱,您可以进行试验。 BigQuery Sandbox允许您自由访问并尝试使用BigQuery功能,但有一些限制。 使用沙盒,您可以使用BigQuery而无需创建账单帐户或为项目启用账单。
They also offer 3-month, $300 free trial, which you might be eligible.
他们还提供3个月,300美元的免费试用版,您可能有资格。
To use BigQuery sandbox, just go to this URL.
要使用BigQuery沙箱,只需转到该URL。
https://console.cloud.google.com/bigquerySign in with a Google Account (using an incognito mode preferably). Note that SANDBOX sign at the top left of the image below, which indicates that you are now in a free sandbox environment (10 GB of active storage and 1 TB of processed query data per month)
使用Google帐户登录(最好使用隐身模式)。 请注意,下图左上方的SANDBOX符号表示您现在处于免费的沙箱环境中(每月10 GB的活动存储空间和1 TB处理的查询数据)
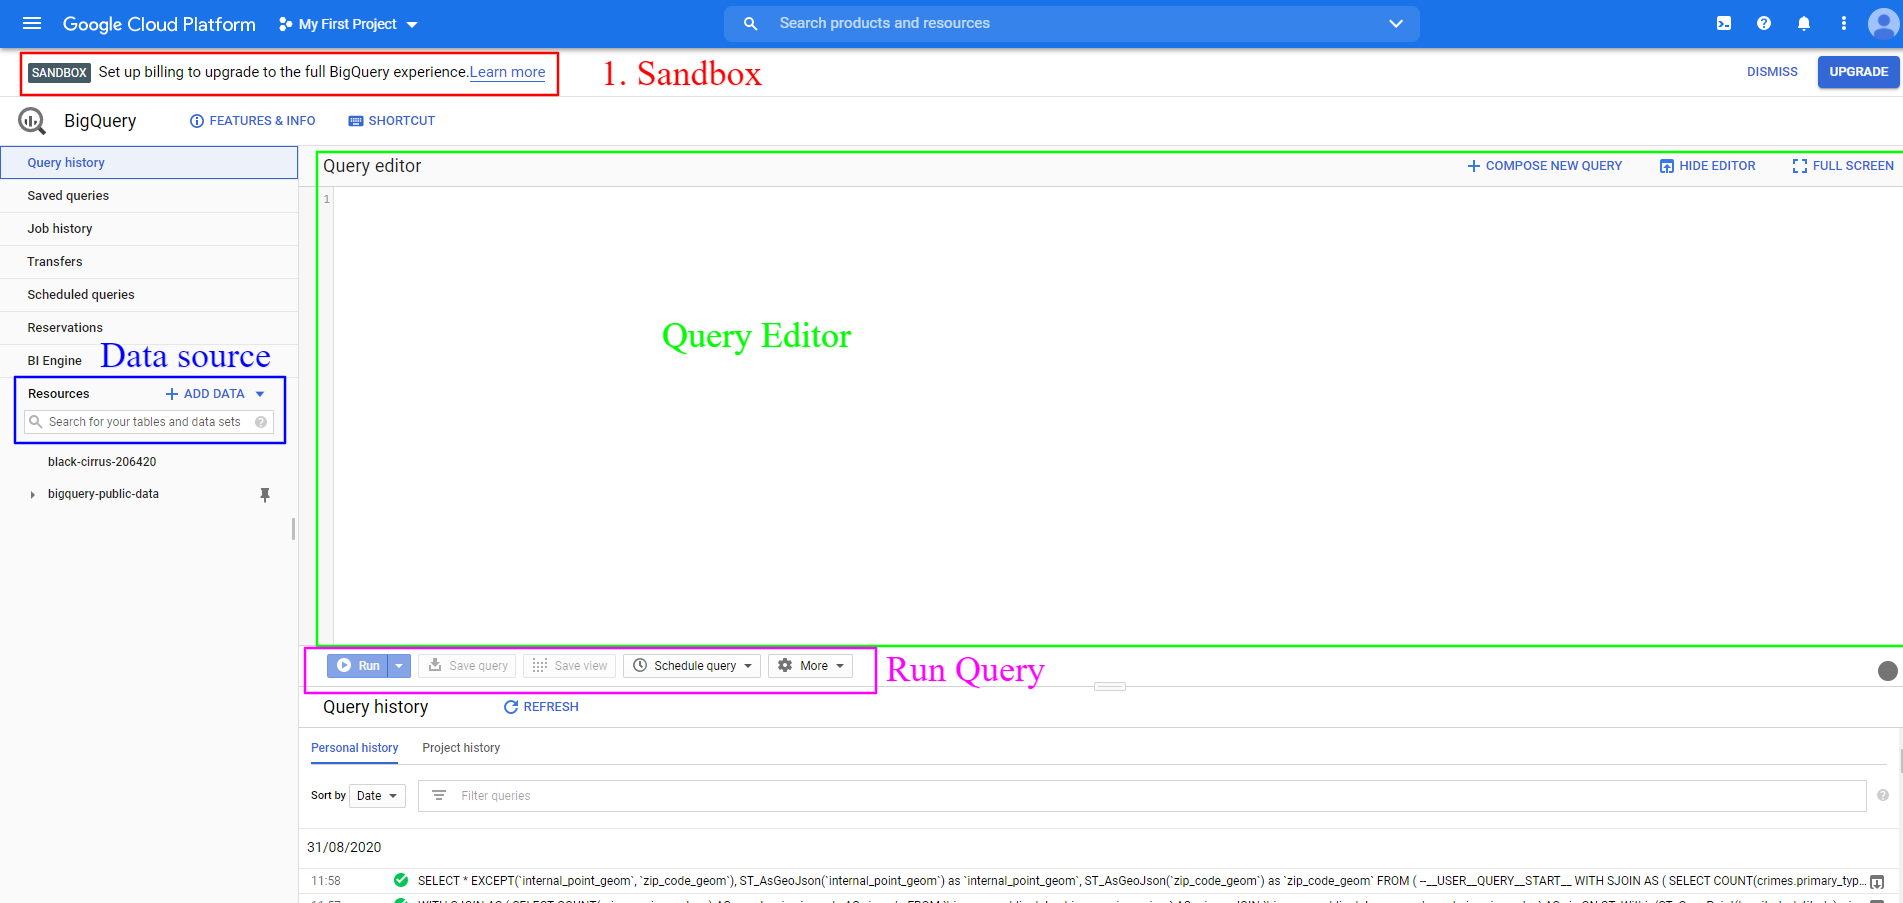
You can add data sources in the resources panel (highlighted blue in the left).In the middle panel, you have the query editor, where you can write your SQL syntax (Highlighted Green). Once you have your SQL ready, you can run the query using the run button.
您可以在资源面板中添加数据源(左侧以蓝色突出显示)。在中间面板中,具有查询编辑器,您可以在其中编写SQL语法(绿色突出显示)。 准备好SQL之后,可以使用运行按钮运行查询。
BigQuery公开数据集 (BigQuery Public Datasets)
Google has an extensive repository of Public datasets. At the time of writing this article, the number of available public datasets was 195. In this tutorial, we will use one of the open public datasets: Chicago crime. Feel free to identify an interesting dataset from the list and experiment with it, but all the examples in this article will be using Chicago Crime Data.
Google拥有大量的公共数据集。 在撰写本文时,可用的公共数据集数量为195。在本教程中,我们将使用一个开放的公共数据集:Chicago Crime。 可以从列表中随意识别有趣的数据集并进行试验,但是本文中的所有示例都将使用Chicago Crime Data。
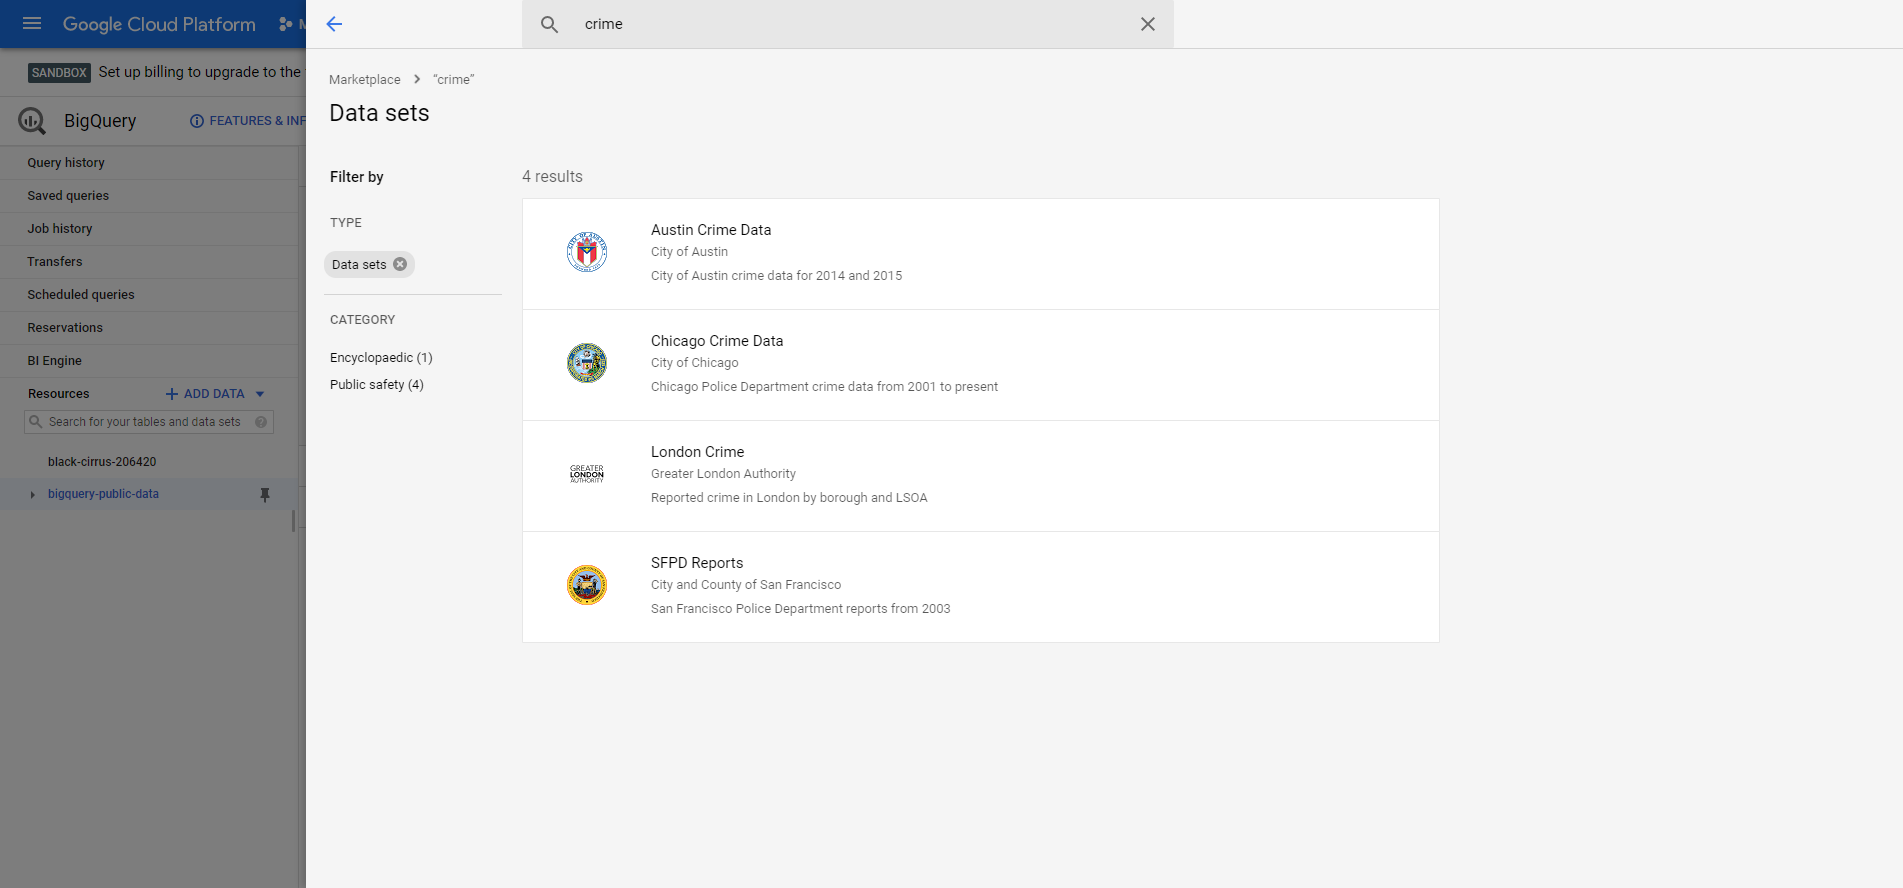
To add a public dataset, you need to click on+ sign ADD DATA and then click on Explore public data set . Choose an exciting dataset and click on it to view the dataset. In this example, we are using the Chicago Crime datasets.
要添加公共数据集,您需要点击+ sign ADD DATA ,然后点击Explore public data set 。 选择一个令人兴奋的数据集,然后单击它以查看数据集。 在此示例中,我们使用芝加哥犯罪数据集。
Now that we have added public query datasets, we can query them. Let us see that in the next section.
现在我们已经添加了公共查询数据集,我们可以对其进行查询。 让我们在下一部分中看到它。
使用BigQuery运行GIS查询 (Running GIS Queries with BigQuery)
You can now run standard SQL queries to explore public datasets. However, since these datasets are usually large, you can run select statements with limiting the number of rows to preview the first few rows of the dataset or look at the schema of the table. However, You can preview the schema and few rows of the dataset without running any SQL code and saving the running query cost.
现在,您可以运行标准SQL查询来浏览公共数据集。 但是,由于这些数据集通常很大,因此可以在限制行数的情况下运行select语句,以预览数据集的前几行或查看表的架构。 但是,您可以预览架构和数据集的几行,而无需运行任何SQL代码并节省运行查询的成本。
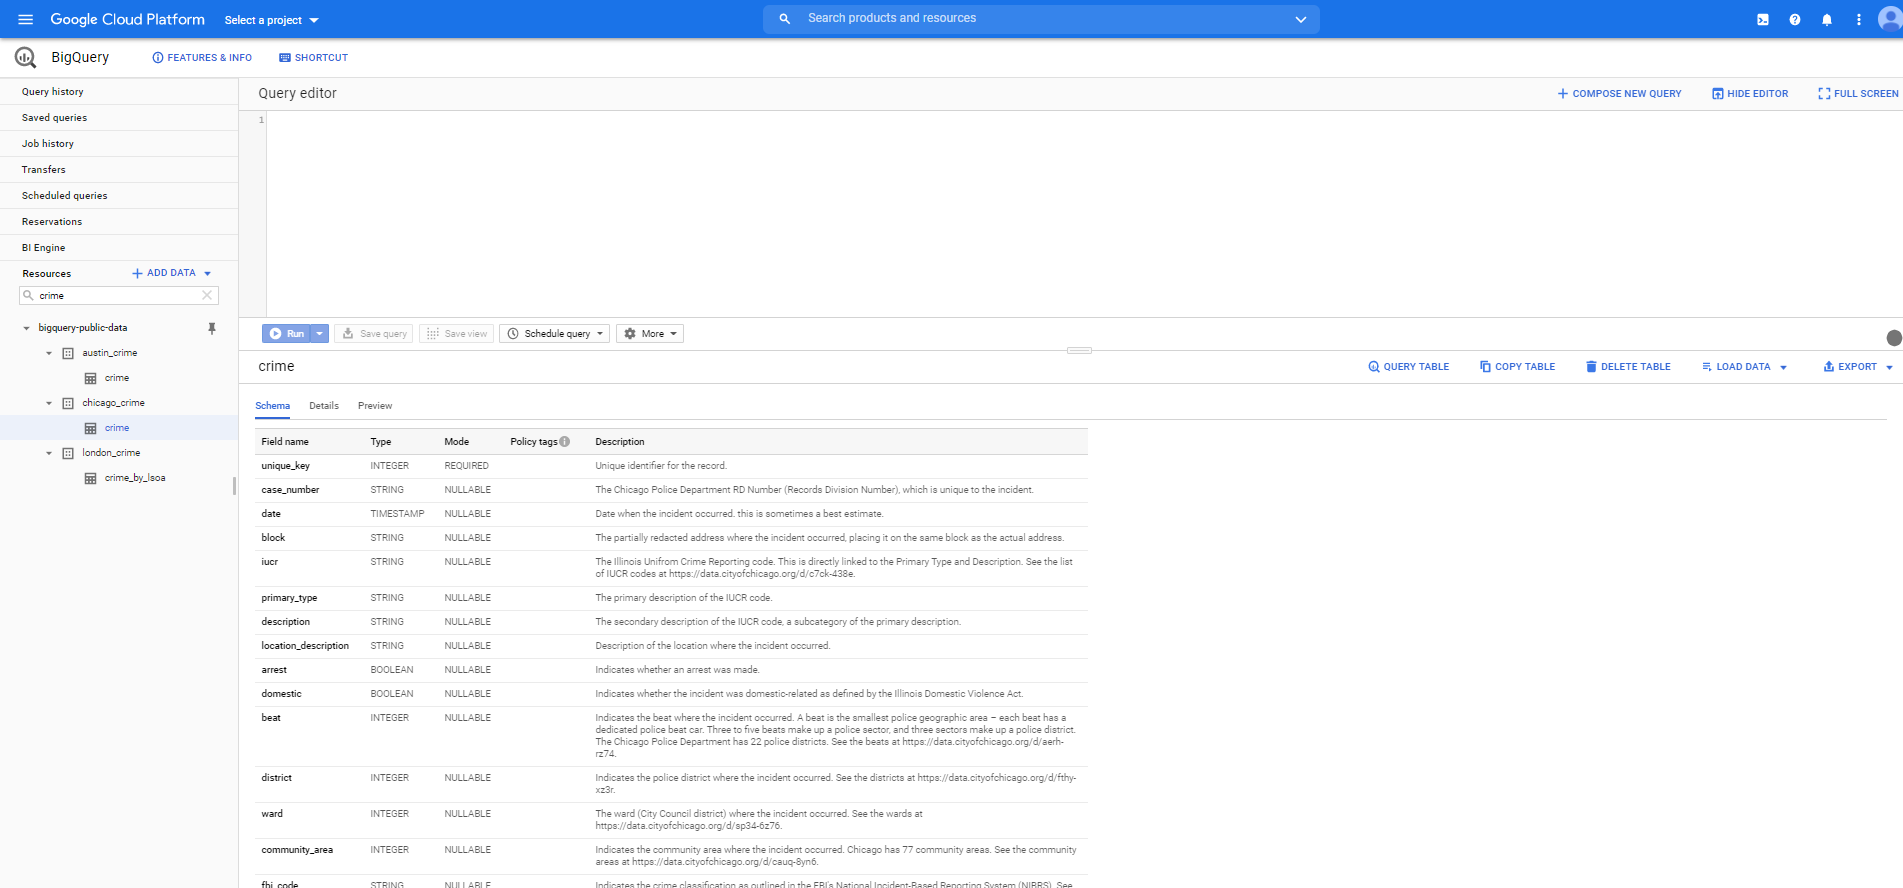
To view the schema of the dataset. Click on the dataset and in the lower button, and you will see the Schema of the table (shown below).
查看数据集的架构。 单击数据集并单击下面的按钮,您将看到表的Schema (如下所示)。
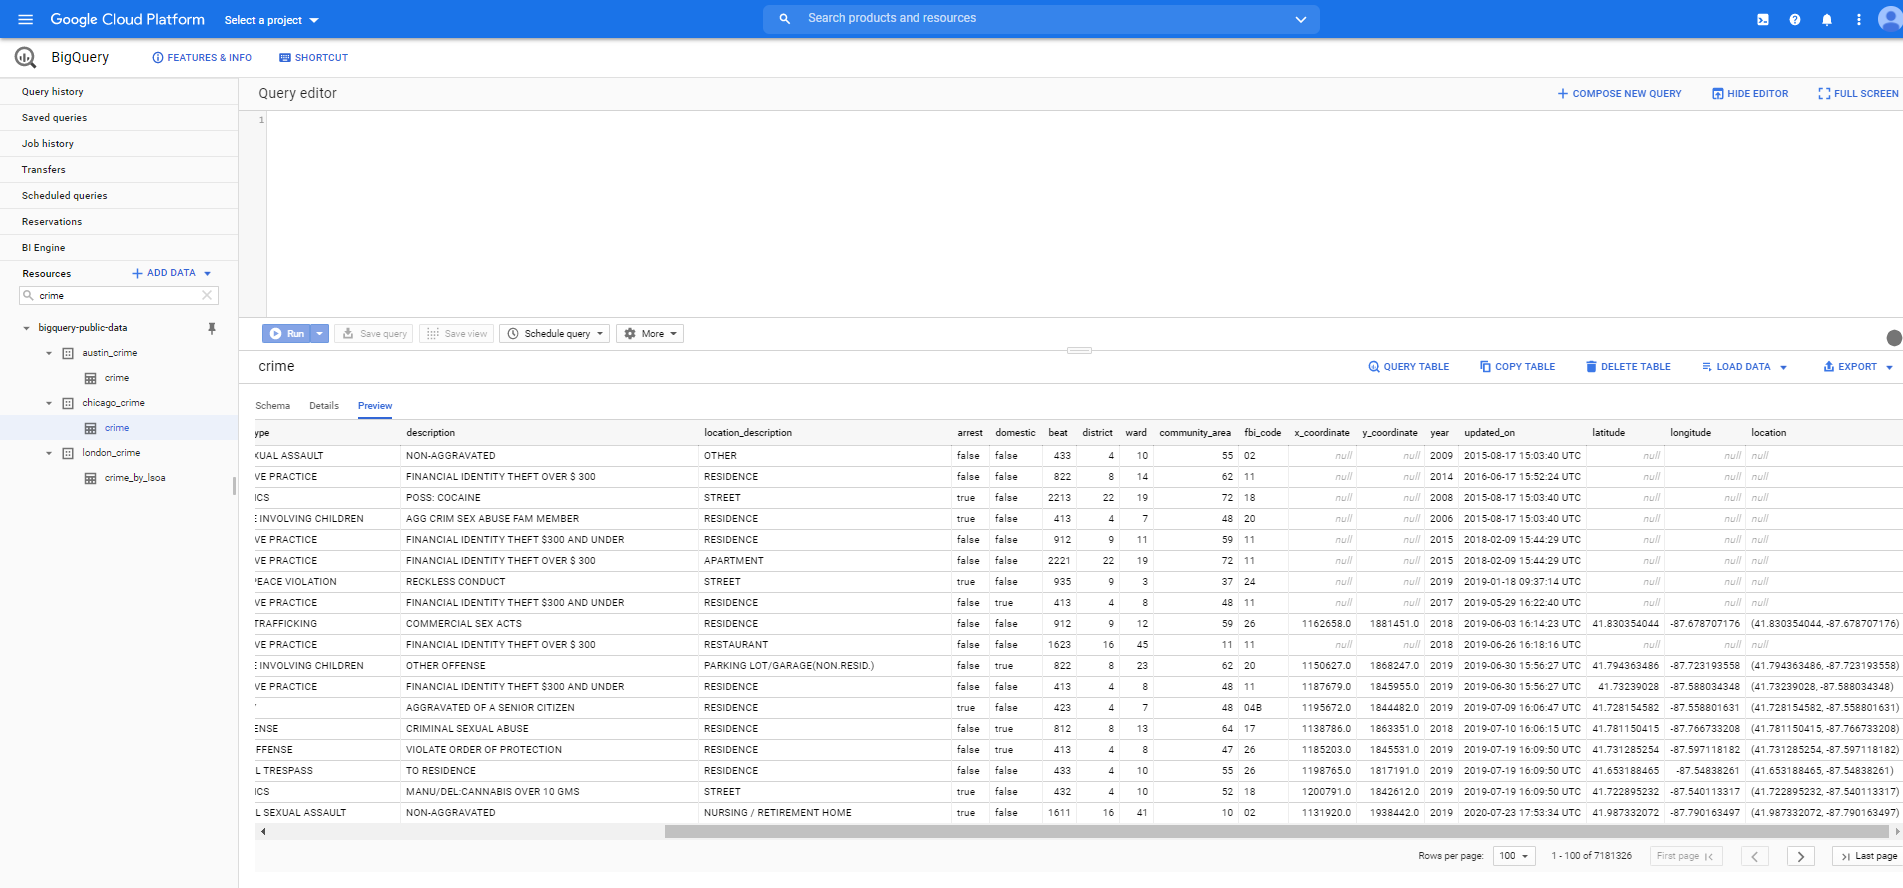
If you want to preview the first few rows, you can then click on the Preview , then you should see some rows of the dataset as shown below.
如果要预览前几行,则可以单击Preview ,然后应该看到数据集的某些行,如下所示。
In the next section, we will go through the geographic features of BigQuery.
在下一部分中,我们将介绍BigQuery的地理特征。
创建和处理地理特征 (Creating and Processing Geographic Features)
Our table has longitude and latitude columns; therefore, we can transform these values into geographic features using SQL geography functions. If you are already familiar with PostGIS, BigQuery GIS SQL syntax should also be typical.
我们的表格有经度和纬度列; 因此,我们可以使用SQL地理功能将这些值转换为地理特征。 如果您已经熟悉PostGIS,则BigQuery GIS SQL语法也应该很典型。
We can create a geography column using ST_GeogPoint function. Let us see an example.
我们可以使用ST_GeogPoint函数创建一个地理列。 让我们来看一个例子。
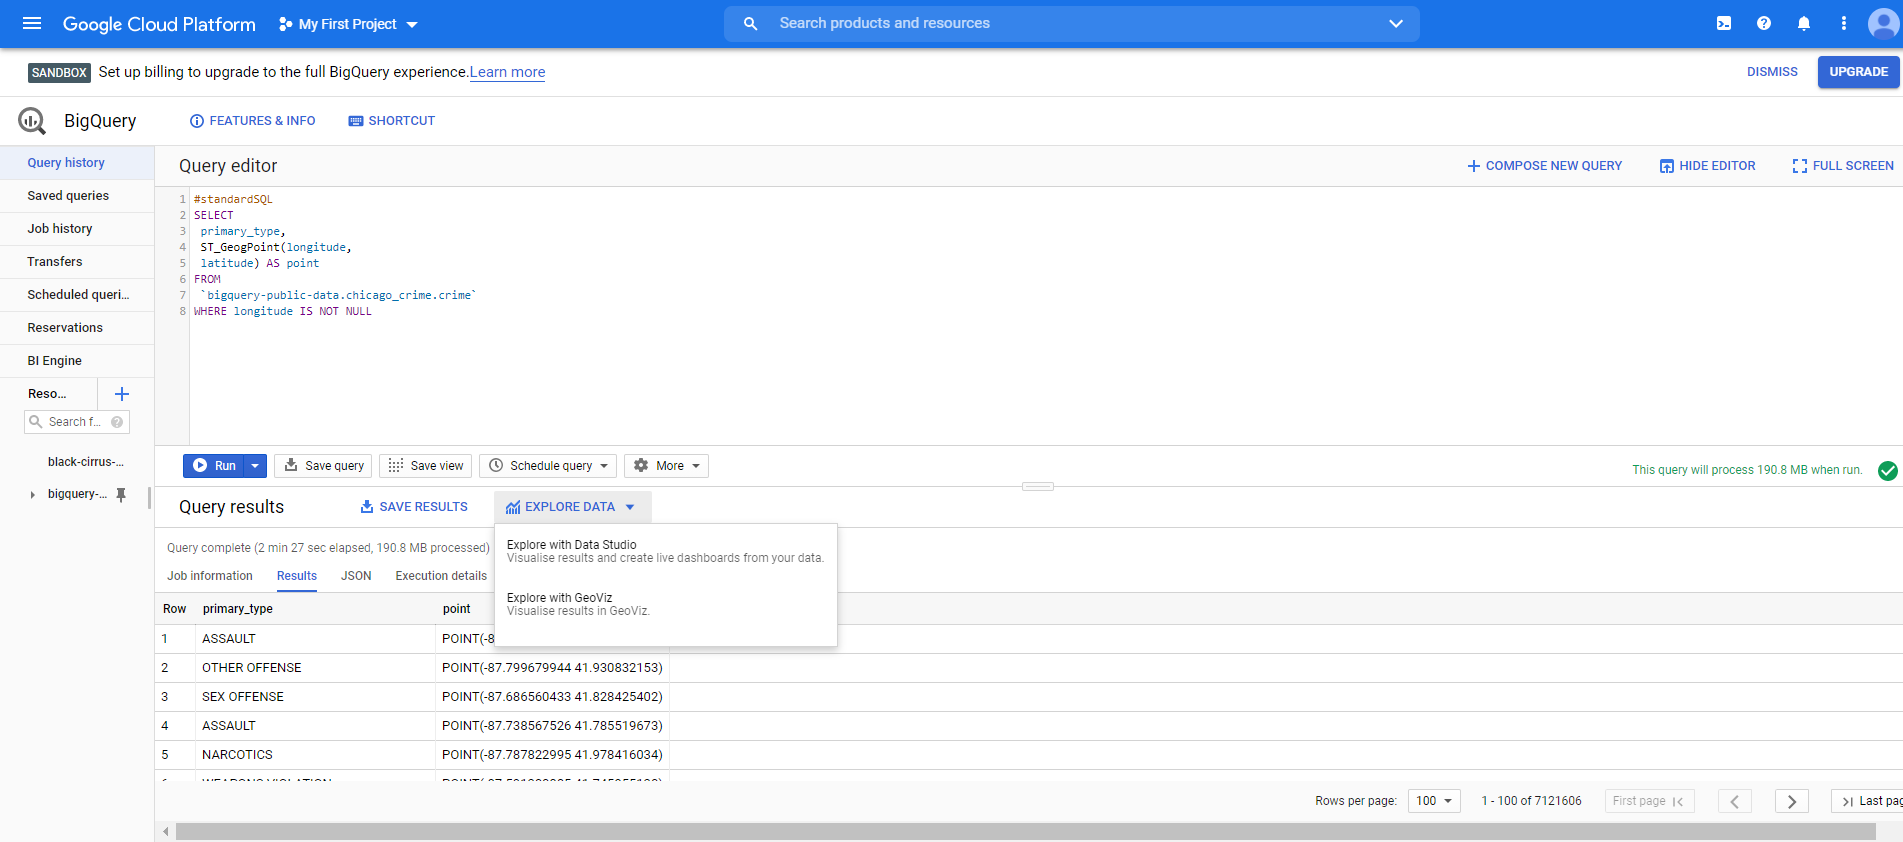
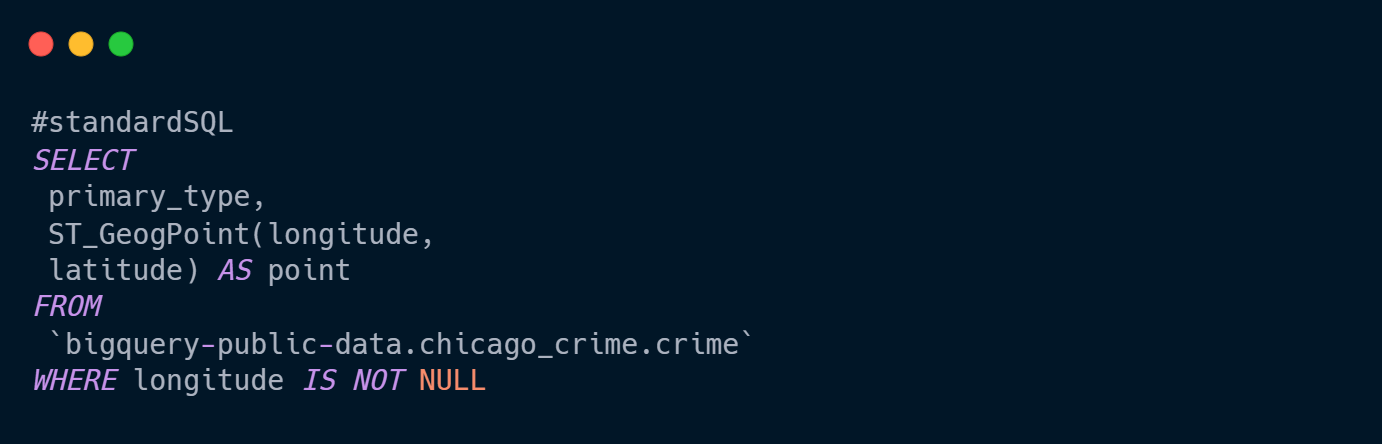
Let us go through the SQL syntax first. We select the primary_type of the crime and create a geographic point using ST_GeogPoint and pass the latitude and longitude columns. We also remove all NULL values in longitude column since we can not make a geographic point with coordinates.
让我们首先了解一下SQL语法。 我们选择犯罪的primary_type,并使用ST_GeogPoint创建一个地理点,然后传递纬度和经度列。 我们也删除了经度列中的所有NULL值,因为我们无法使用坐标创建地理位置。
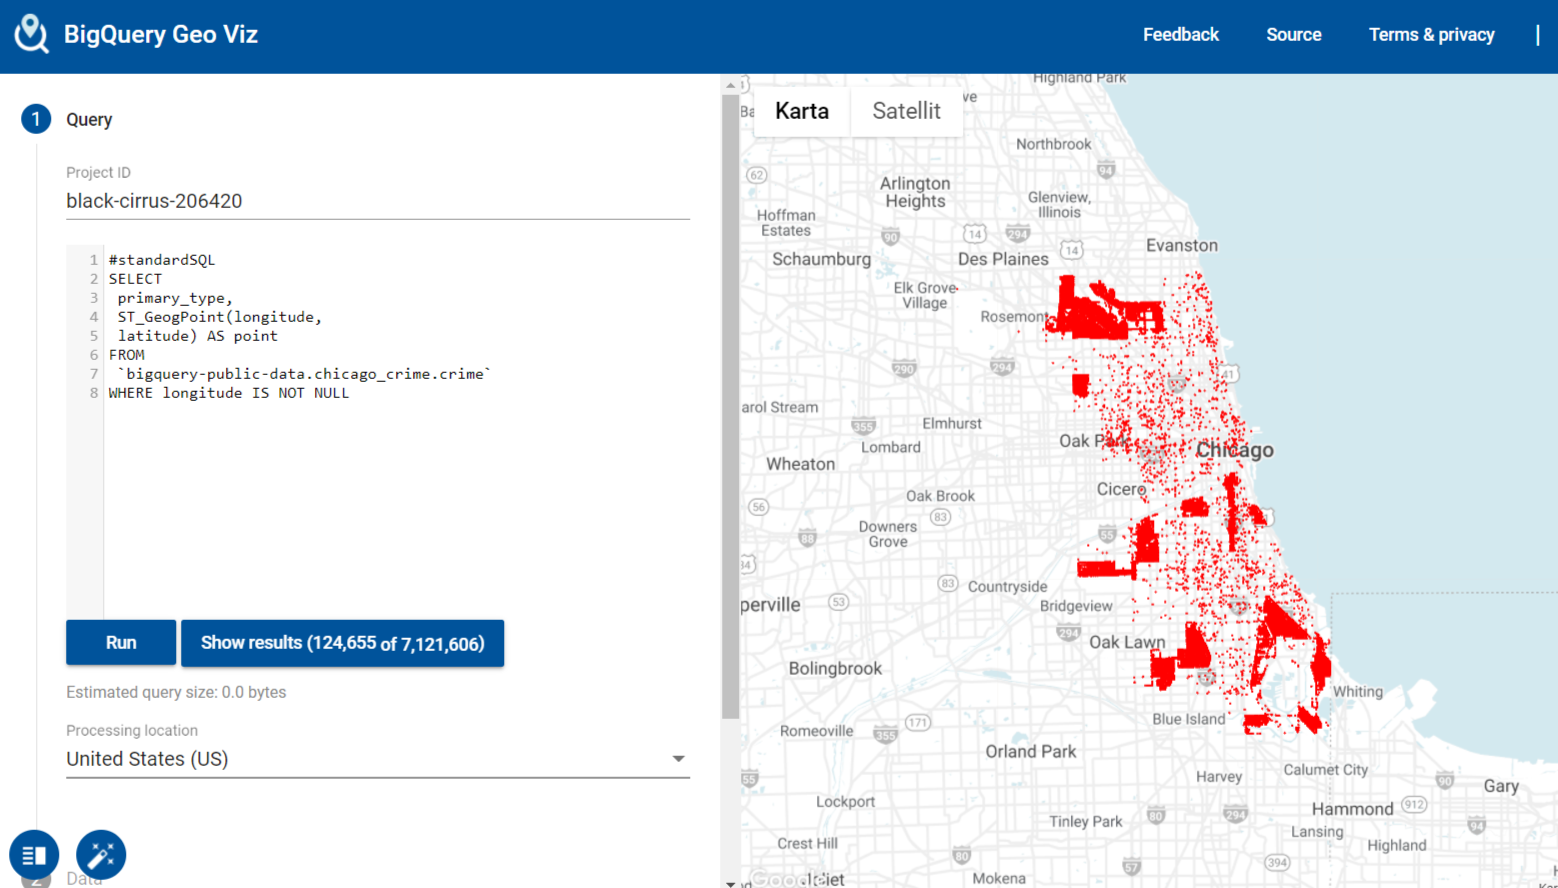
If you look at the image above, you can save the results, but more importantly, BigQuery has a GIS visualization where you can plot maps interactively. To visualize geospatial data, click Explore with GeoViz and then a new window will pop up. Click on Authorize and sign in with your account. You should now get the SQL syntax you have run earlier copied in BigQuery Geo Viz tool. Click on Run . You should now see a base map with the results of the SQL, in this case, crime points.
如果您查看上面的图像,则可以保存结果,但更重要的是,BigQuery具有GIS可视化功能,您可以在其中交互式地绘制地图。 要可视化地理空间数据,请单击Explore with GeoViz然后会弹出一个新窗口。 单击Authorize并使用您的帐户登录。 现在,您应该已经在BigQuery Geo Viz工具中复制了之前运行SQL语法。 点击Run 。 现在,您应该看到带有SQL结果的基本映射,在这种情况下为犯罪点。
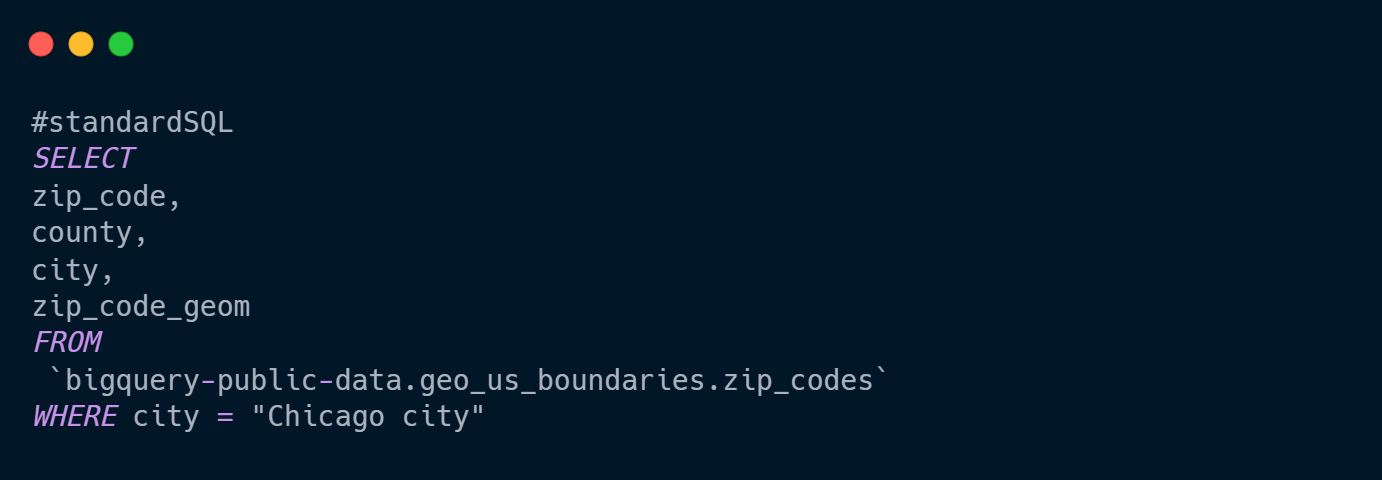
If the data is already in Geospatial Format, running a simple SQL query will be enough. Say, for example, we want to get zip codes in Chicago. Big Query has a public dataset on geo_us_boundaries, and we can run a select statement including the geom column.
如果数据已经是地理空间格式,则运行简单SQL查询就足够了。 举例来说,我们要在芝加哥获得邮政编码。 Big Query在geo_us_boundaries上有一个公共数据集,我们可以运行包括geom列的select语句。
Now, we can visualize the results with BigQuery Geo Viz tool.
现在,我们可以使用BigQuery Geo Viz工具可视化结果。
Now, that we can query Geographic datasets in BigQuery, Let us move on to a more advanced example using spatial join functions.
现在,我们可以在BigQuery中查询地理数据集,让我们继续使用空间连接函数的更高级示例。
空间连接 (Spatial Join)
Spatial join is one of the most widely used spatial processes. We use spatial join when we want to join data by location. Let us say we want to join each crime point to its zip code. We can use ST_Within function to check whether the point is inside or outside the zip code.
空间连接是使用最广泛的空间过程之一。 当我们想按位置连接数据时,我们使用空间连接。 假设我们想将每个犯罪点加入其邮政编码。 我们可以使用ST_Within函数检查该点是在邮政编码内部还是外部。
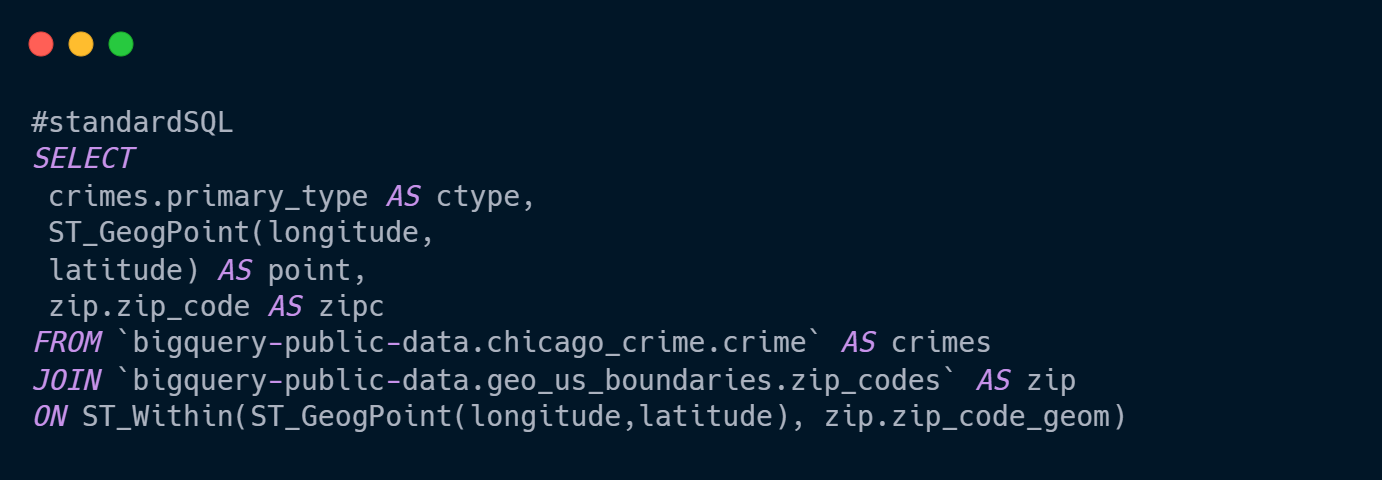
The above SQL query joins Chicago crime points to zip codes. We are using ST_Within function and pass the geographic points from the crimes and zip code geometry. The result is the table below where each point is matched with its zip code.
上面SQL查询将Chicago犯罪点连接到邮政编码。 我们正在使用ST_Within函数,并通过犯罪和邮政编码几何传递地理点。 结果是下表,其中每个点均与其邮政编码匹配。
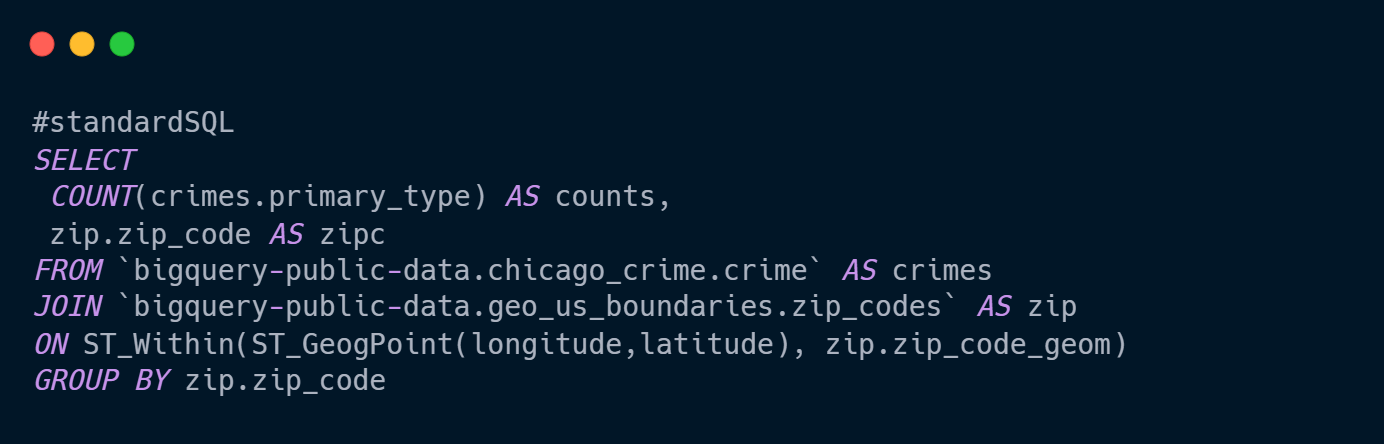
If we would like to count the number of crimes in each zip code, we can add a group by statement. The following SQL query returns the count of crimes in each zip code.
如果我们想计算每个邮政编码中的犯罪数量,则可以按语句添加组。 以下SQL查询返回每个邮政编码中的犯罪计数。
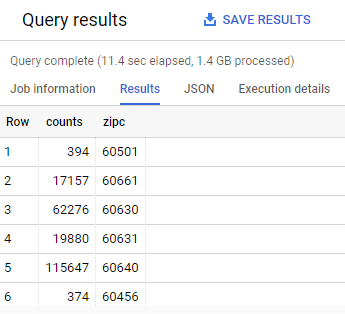
The result is shown below. We counted all crimes in each zip code.
结果如下所示。 我们计算了每个邮政编码中的所有犯罪。
You realize that we do not have any Geographic features because we could not group by a geographic feature. However, we can run with-statement queries to get the zip code geometry as well as the count of all crimes in each zip code.
您意识到我们没有任何地理要素,因为我们无法按地理要素分组。 但是,我们可以运行带有语句的查询来获取邮政编码的几何形状以及每个邮政编码中所有犯罪的计数。
Let us try that (See the SQL query below). There is nothing new here, we first run the usual group by a statement with spatial join and then joined to the actual zip code geometries.
让我们尝试一下(请参见下面SQL查询)。 这里没有什么新鲜的东西,我们首先使用带有空间连接的语句运行通常的组,然后再连接到实际的邮政编码几何。
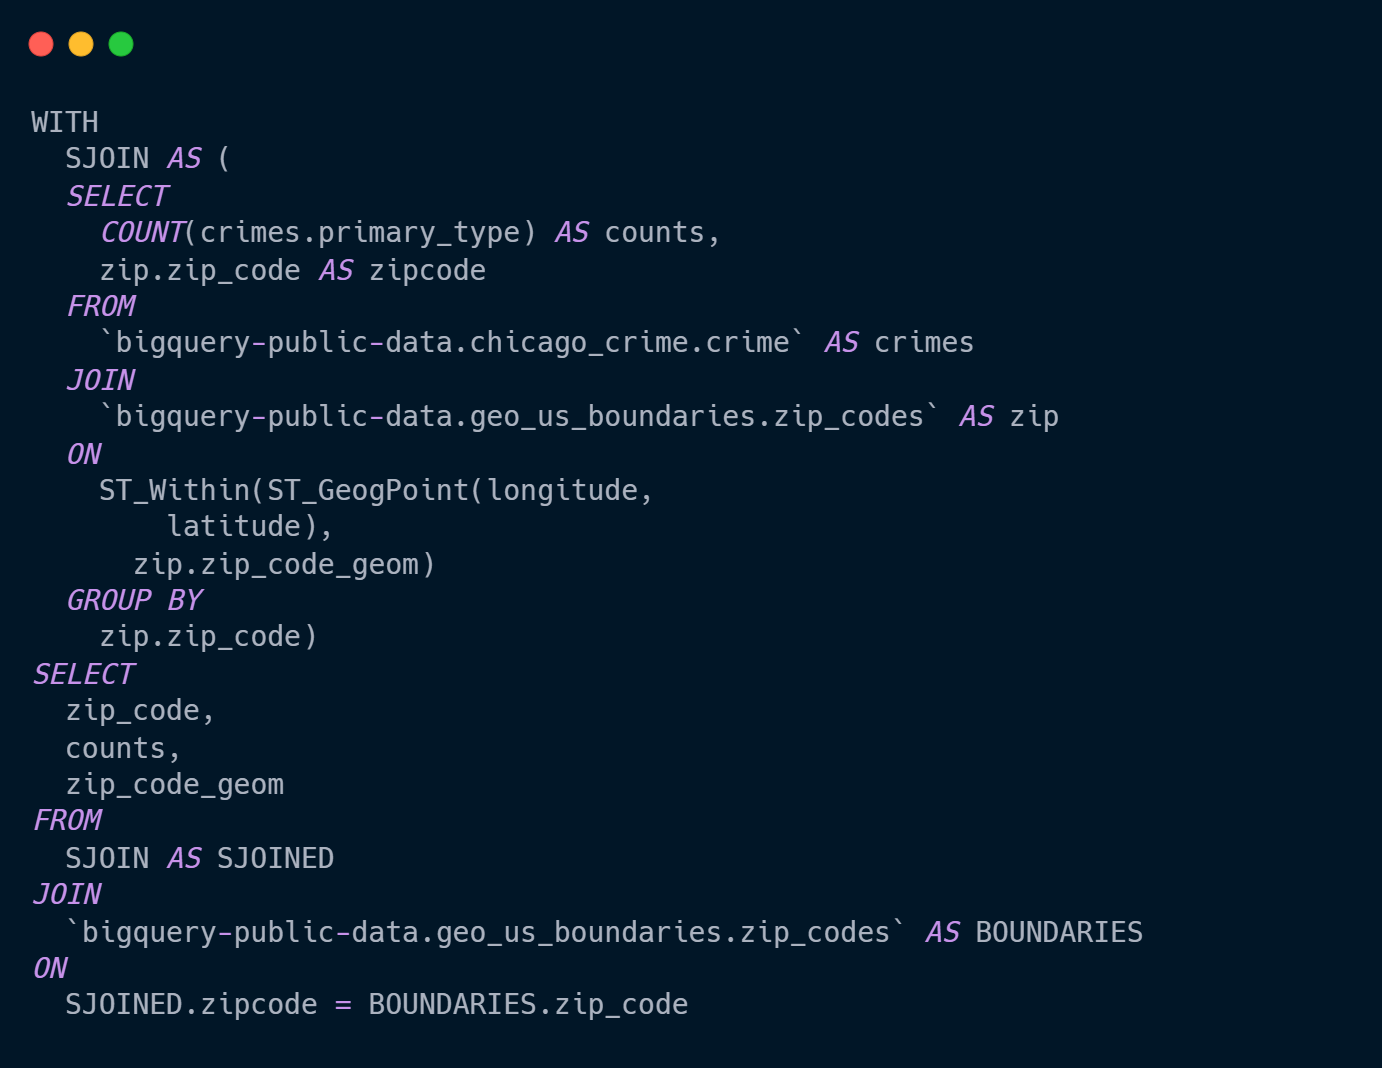
The query result is shown below. You can see now that we have included the geometry column in our results.
查询结果如下所示。 现在您可以看到我们的结果中包括了geometry列。

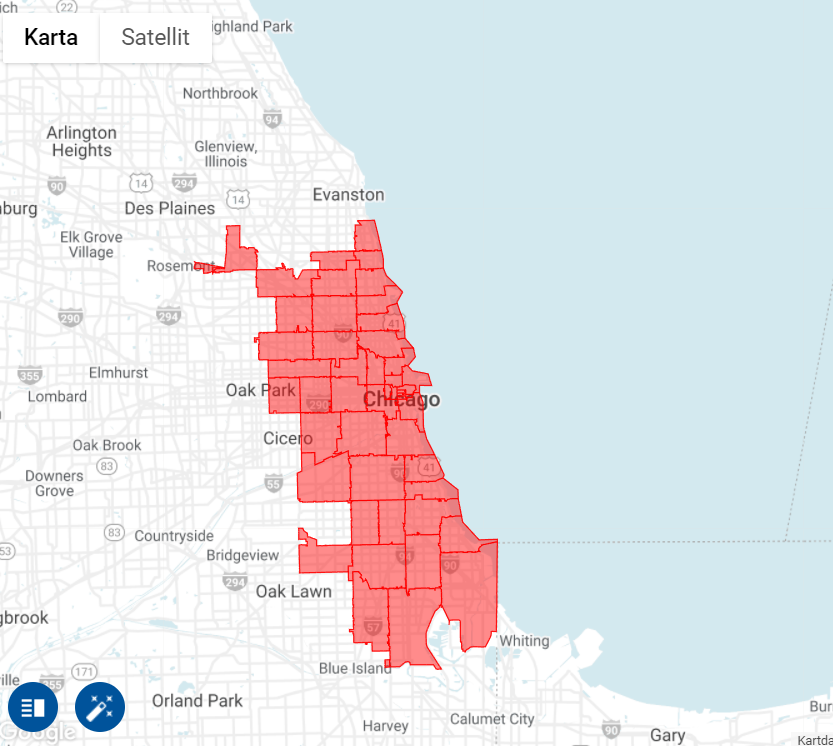
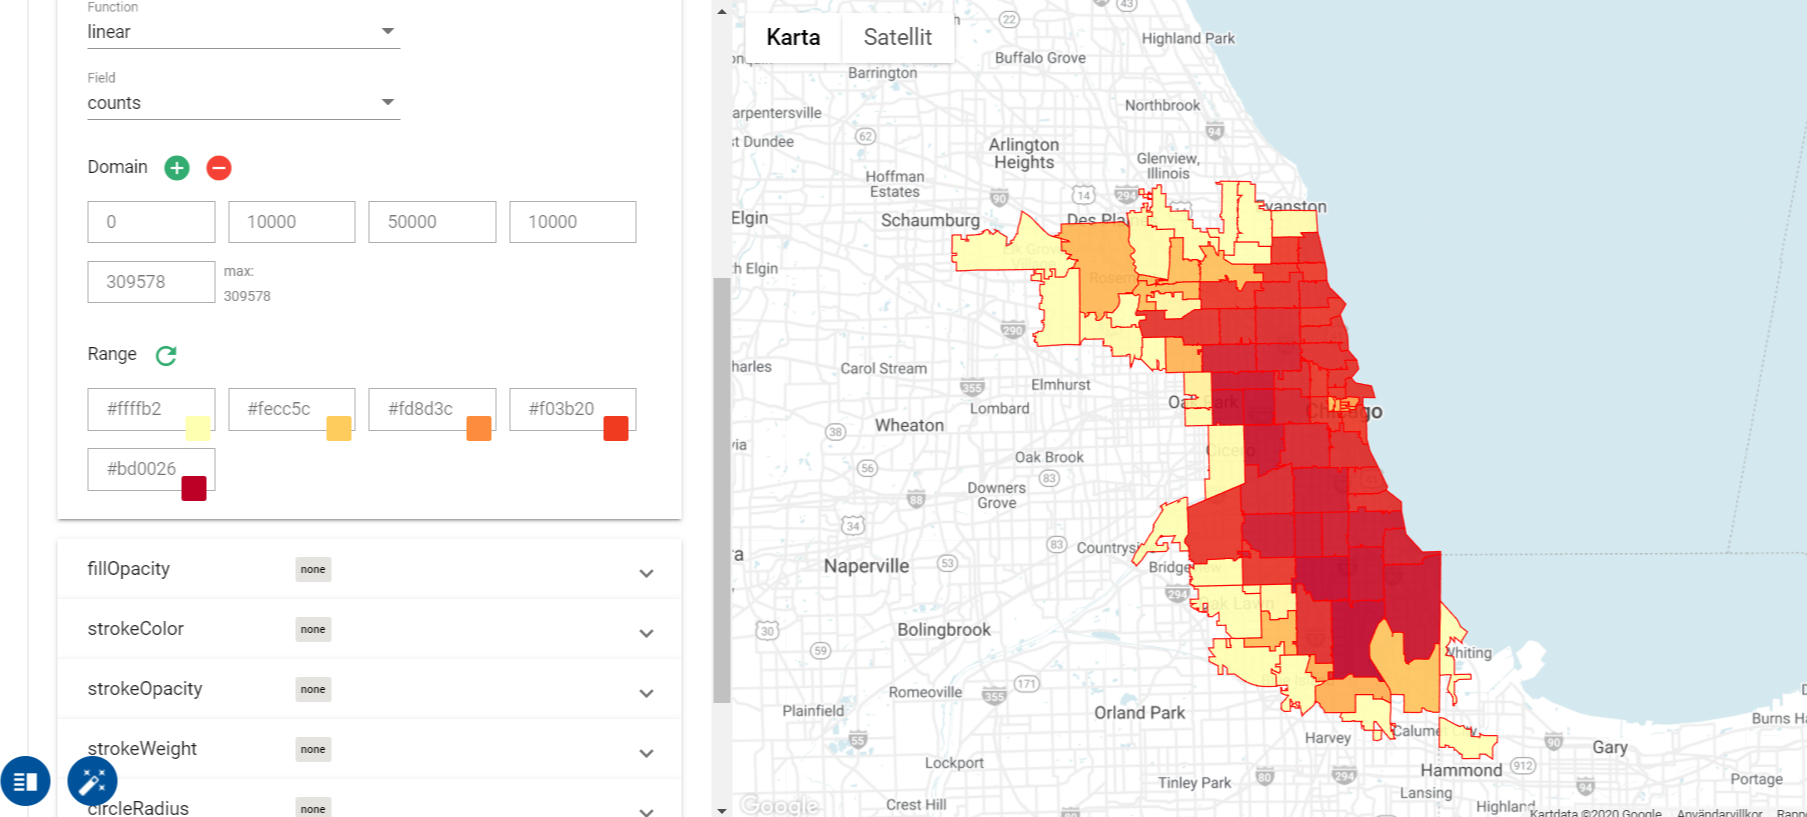
Since we have a geometry column, we can also use the Goeviz tool to visualize the results. I needed to style the map, and therefore I used the counts’ column to plot a choropleth map (See below map).
由于我们有一个几何列,所以我们也可以使用Goeviz工具来可视化结果。 我需要对地图进行样式设置,因此我使用了counts列来绘制Choropleth映射(请参见下图)。
结论(Conclusion)
In this article, we have covered some basic geographic functionality of BigQuery using the free Sandbox. After getting familiar with the BigQuery Interface, we have created and run simple queries using Geographic functions of BigQuery GIS. Finally, we have carried out an example of joining data by location.
在本文中,我们使用免费的沙盒介绍了BigQuery的一些基本地理功能。 熟悉BigQuery界面后,我们使用BigQuery GIS的地理功能创建并运行了简单的查询。 最后,我们进行了一个按位置连接数据的示例。
There is a large number of Geographic functions in BigQuery GIS. You can find them here.
BigQuery GIS中有大量的地理功能。 您可以在这里找到它们。
翻译自: https://towardsdatascience.com/a-beginners-guide-to-google-s-bigquery-gis-46a1193499ef


 被折叠的 条评论
为什么被折叠?
被折叠的 条评论
为什么被折叠?
 到【灌水乐园】发言


