


 本文探讨了数据分析师和科学家需要掌握的SQL与Python pandas库的数据处理技能。通过并排比较,展示了如何在pandas中实现常见的SQL查询。
Being able to skillfully manipulate data with both SQL and pandas, a data analysis library in Python, is a valuable skill to have for data analysts, data scientists and anyone working with data. In this post, we will look at side-by-side comparisons of SQL queries and their counterparts in pandas.
能够同时使用SQL和pandas(Python中的数据分析库)熟练地处理数据,对于数据分析师,数据科学家和从事数据工作的任何人来说都是一项宝贵的技能。 在这篇文章中,我们将研究SQL查询及其在熊猫中对应查询的并排比较。
There are often many ways to achieve the same output. Therefore, for some SQL queries, we will cover a selected few of their equivalents in pandas.
通常有很多方法可以达到相同的输出。 因此,对于某些SQL查询,我们将介绍一些与之等效的大熊猫。
0.数据集 (0. Dataset 📦)
If you haven’t already, make sure you have both pandas and seaborn installed.
We will use seaborn’s dataset on restaurant tips as our sample dataset. Details about this dataset can be found here (this source is actually for R, but it appears to be referring to the same underlying dataset). I have quoted their data description below for quick access:
我们将使用餐厅提示上的seaborn数据集作为样本数据集。 可以在此处找到有关此数据集的详细信息(此来源实际上是R的来源,但它似乎是在指相同的基础数据集)。 为了快速访问,我在下面引用了它们的数据描述:
# Import packages
import pandas as pd
import seaborn as sns# Import data
tips = sns.load_dataset('tips')
📍1.查看数据提取 (📍 1. View data extract)
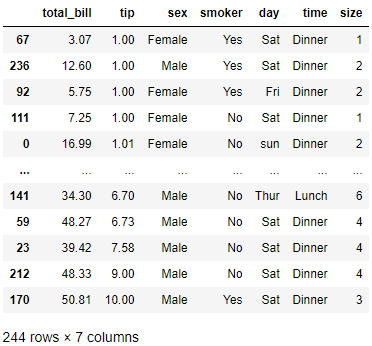
Let’s start simple by looking at the top 5 records in the dataset:
让我们从查看数据集中的前5条记录开始简单:

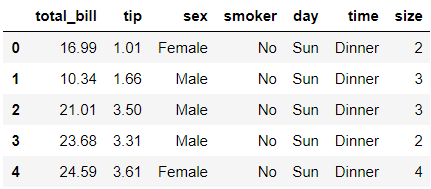
In head() method, we can specify the number of rows inside the parantheses like this: tips.head(5). However, we can get away with tips.head() in this example because the default number of rows is set at 5.
在head()方法中,我们可以像这样指定括号内的行数: tips.head(5) 。 但是,在此示例中,我们tips.head()使用tips.head() ,因为默认的行数设置为5。
Instead of viewing all columns, let’s view the top 3 rows with selected columns:
与其查看所有列,不如查看具有选定列的前三行:

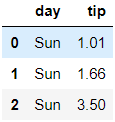
Changing the order of row selection and column selection won’t impact the result in this example. Hence, the image shows two variations. In the first version, we first select columns then specify row selection whereas we do it the other way around in the second version. Now, let’s see how to filter data.
在此示例中,更改行选择和列选择的顺序不会影响结果。 因此,图像显示了两个变化。 在第一个版本中,我们首先选择列,然后指定行选择,而在第二个版本中,我们则相反。 现在,让我们看看如何过滤数据。
📍2.过滤数据 (📍 2. Filter data)
Let’s see the top five records from Thursday:
让我们看看周四的前五项记录:
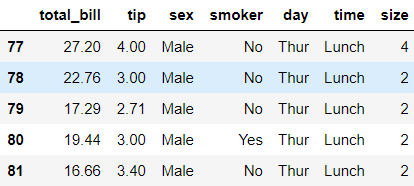
We could achieve the same in pandas with one of three ways shown. The first one is my favourite way to filter data in pandas because it’s more succinct especially when there are multiple conditions to filter. In the other two methods, we filter the data with a boolean mask, which is represented in tips['day']=='Thur' part of the code. This boolean mask will create a boolean value for each record where it is True if the record is from Thursday otherwise False. Because the last two methods are identical except for .loc part, I will show examples only for the latter as the former could be easily inferred from the other. Did you notice that we used == for equality? That’s because = is reserved for assignment in Python. However, >,>=,< and <= work the same way in both. Now, let’s look at some other operators:
我们可以通过以下三种方式之一在大熊猫中实现同样的目标。 第一种是我最喜欢的熊猫数据过滤方法,因为它更简洁,尤其是在有多个条件要过滤的情况下。 在其他两种方法中,我们使用布尔掩码过滤数据,该掩码在代码的tips['day']=='Thur'部分中表示。 如果记录来自星期四,则此布尔掩码将为每个记录创建一个布尔值,如果为True ,则为True ,否则为False 。 因为除了.loc部分外,后两种方法是相同的,所以我将仅显示后者的示例,因为前者可以很容易地从另一种方法推断出来。 您是否注意到我们用==表示平等? 这是因为=保留给Python使用。 但是, > , >= , <和<=两者的工作方式相同。 现在,让我们看一下其他一些运算符:
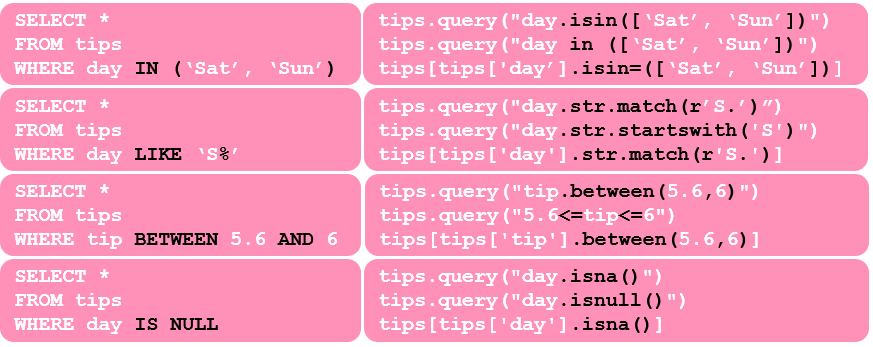
As you can see, there are similarities in keywords between the two. One thing to remember is that Python is case sensitive. This means match(r'S.') and match(r's.') will give us different outputs while LIKE 'S%' or LIKE 's%' in SQL will return the same output. If we want to filter any days starting with ‘s’ regardless of the case, one way to to achieve that is to use match(r'[Ss]'). If we had a weekday named ‘S’ for some records, WHERE day LIKE ‘S%' and .str.startswith(‘S') will pick these cases while .str.match(r'S.') will not. If we wanted to cater for this kind of cases, then we will modify the script to .str.match(r'S.?'). Now, let’s look at negations:
如您所见,两者之间的关键字相似。 要记住的一件事是Python是区分大小写的。 这意味着match(r'S.')和match(r's.')将为我们提供不同的输出,而LIKE 'S%'或LIKE 's%'将返回相同的输出。 如果我们想过滤任何以's'开头的日子,无论如何,都可以使用match(r'[Ss]') 。 如果我们在某工作日有一个名为“ S”的工作日,那么WHERE day LIKE 'S%'和.str.startswith('S')会选择这些情况,而.str.match(r'S.')则不会。 如果我们想满足这种情况,则将脚本修改为.str.match(r'S.?') 。 现在,让我们看一下否定:
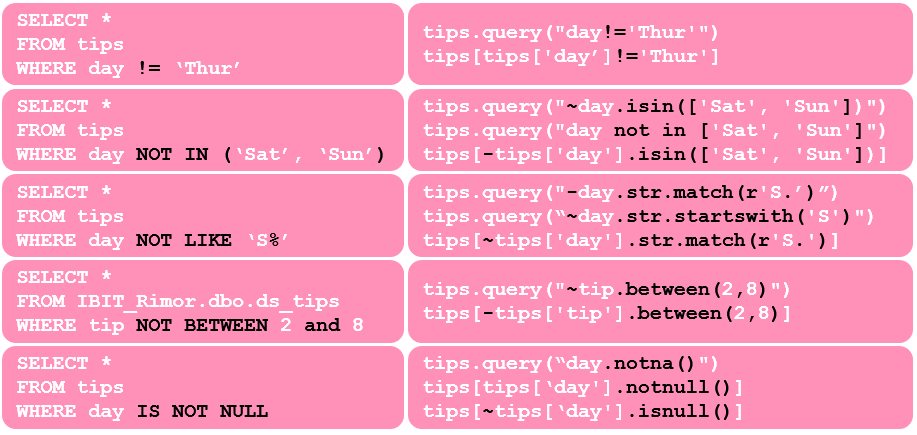
You may already noticed that equivalent of NOT in SQL is either - or ~ in pandas. Now, let’s see how to filter with multiple conditions with AND or OR:
您可能已经注意到,SQL中NOT等效项是-或~在熊猫中。 现在,让我们看看如何使用AND或OR对多个条件进行过滤:
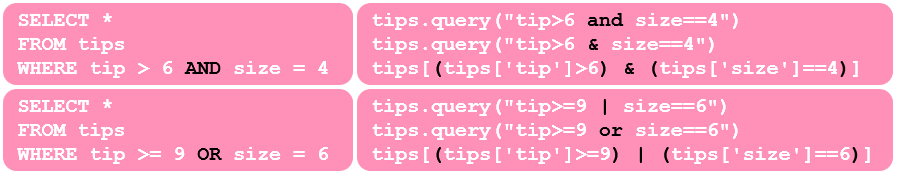
💡 In Python,
andororare known as boolean operators whereas&or|are considered as bitwise operators.💡在Python,
and或or已知为布尔运算符,而&或|被视为按位运算符。
As you can see, filtering with query is more concise than boolean masks. It is also more flexible because we can use either boolean or bitwise operators. On the other hand, when filtering with boolean masks, only bitwise operators are supported. That is tips[(tips['tip']>=9) or (tips['size']==6)] will give an error. If you want to know why, have a look at this thread on StackOverFlow.
如您所见,使用query过滤比使用布尔掩码更为简洁。 由于我们可以使用布尔运算符或按位运算符,因此它也更加灵活。 另一方面,使用布尔掩码进行过滤时,仅支持按位运算符。 那就是tips[(tips['tip']>=9) or (tips['size']==6)]都会产生错误。 如果您想知道为什么,请查看StackOverFlow上的该线程。
However, when using query() depending on your version of pandas, you may encounter an issue described here: TypeError: ‘Series’ objects are mutable, thus they cannot be hashed. If this happens, use the alternative filtering method using boolean mask instead.
但是,当根据您的熊猫版本使用query()时,您可能会遇到这里描述的问题: TypeError: 'Series' objects are mutable, thus they cannot be hashed 。 如果发生这种情况,请改用布尔掩码代替过滤方法。
📍3.排序数据 (📍 3. Sort data)
Let’s now see how to sort the data by one column in an ascending order:
现在,让我们看一下如何按一列的升序对数据进行排序:

Just like we could use ORDER BY tip ASC in SQL, we could use tips.sort_values(tip’, ascending=True) in pandas. However, I find these extra verbosity redundant. If we were to sort in descending order, we use:
就像我们可以在SQL中使用ORDER BY tip ASC ,我们可以在熊猫中使用tips.sort_values(tip', ascending=True) 。 但是,我发现这些多余的冗长性是多余的。 如果我们按降序排序,则使用:

See how boolean value could also be represented by an integer? Let’s see how to sort by multiple columns:
看看布尔值也可以用整数表示吗? 让我们看看如何按多列排序:
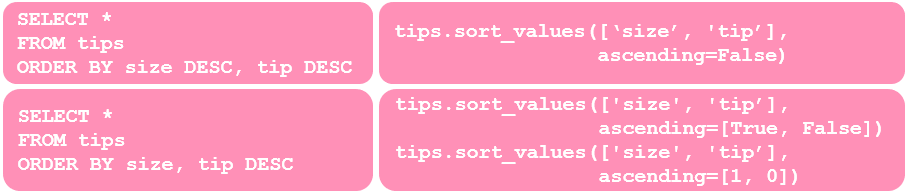
That is it for sorting!
就是为了排序!
📍4.汇总数据 (📍 4. Aggregate data)
Often, we want to aggregate the data and examine summary measures, let’s start with the most basic one. This is how to check the number of rows:
通常,我们希望汇总数据并检查汇总度量,让我们从最基本的度量开始。 这是检查行数的方法:

In pandas, if we run tips.shape, it will show us both number of rows and columns in this format: (#rows, #columns). Here, we are only filtering in the number of rows by adding [0]. Another common aggregation is to find summary statistics. Let’s check the mean for all numeric columns:
在熊猫中,如果我们运行tips.shape ,它将以以下格式显示行数和列数:(#rows,#columns)。 在这里,我们仅通过添加[0]过滤行数。 另一个常见的汇总是查找摘要统计信息。 让我们检查所有数字列的均值:
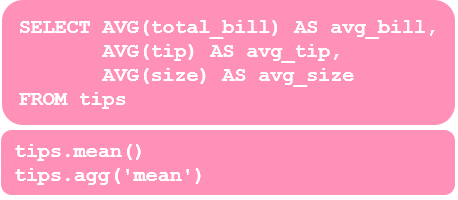
With either of these two options in pandas, all numerical columns will automatically be picked up if the data is in the right type. Therefore, we didn’t have to type all the column names.
使用这两个大熊猫选项中的任何一个,如果数据的类型正确,所有数字列将自动被拾取。 因此,我们不必键入所有列名。
It’s worth noting that agg is actually an alias for aggregate. Therefore, the second option shown is a short form of tips.aggregate('mean').
值得注意的是, agg实际上是aggregate的别名。 因此,显示的第二个选项是tips.aggregate('mean')的简短形式。
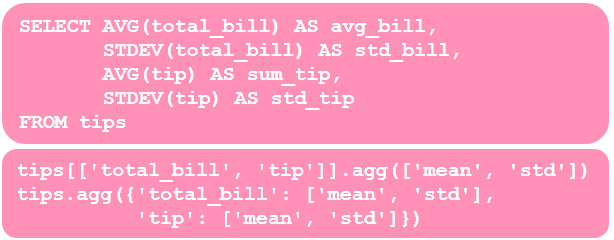
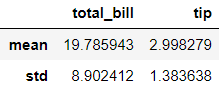
Let’s now inspect minimum and maximum values for a column:
现在让我们检查列的最小值和最大值:
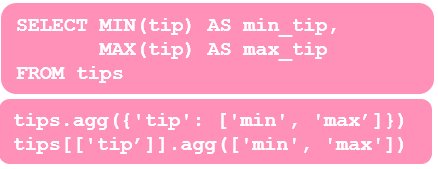

Again, either of these options works. Let’s extend the query further:
同样,这些选项均有效。 让我们进一步扩展查询:
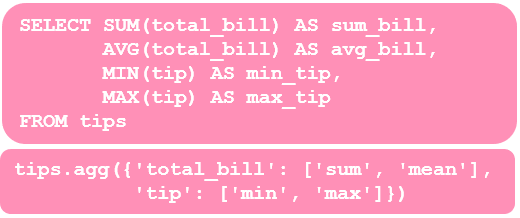
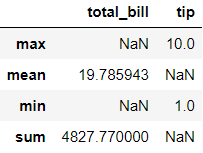
Although the output of these in SQL and pandas are not exactly identical, we get the same summary statistics in slightly different formats. This is how we would extract the same summary statistics for both columns:
尽管这些在SQL和pandas中的输出并不完全相同,但是我们以略有不同的格式获得了相同的摘要统计信息。 这是我们为两列提取相同的摘要统计信息的方式:
Another common query is to check unique values for a column:
另一个常见的查询是检查列的唯一值:


If we want to see the number of unique values instead, then it changes to:
如果我们想查看唯一值的数量,那么它将更改为:


In pandas, we can also get summary statistics using describe(). If we run tips.describe(), we will see a nice table of summary statistics for all numerical columns.
在熊猫中,我们还可以使用describe()获得摘要统计信息。 如果我们运行tips.describe() ,我们将看到一个不错的所有数字列的摘要统计表。
📍5.按组汇总数据 (📍 5. Aggregate data by group)
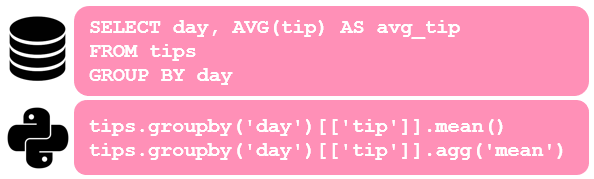
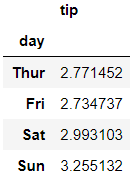
Let’s look at a simple group aggregation example first:
首先让我们看一个简单的组聚合示例:
Another example:
另一个例子:
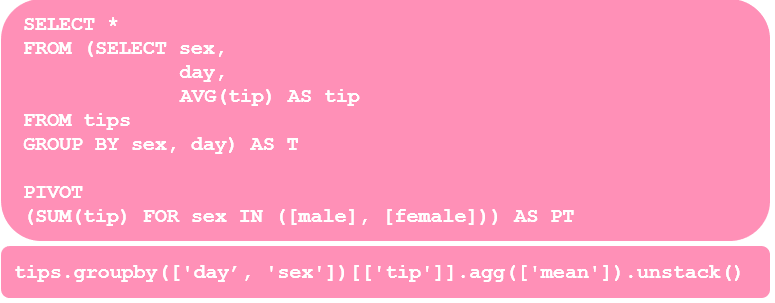
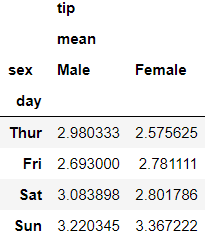
Does making pivot table look easier in pandas? Maybe? 👀 We can also use what we have learned in the aggregation section with group aggregation too.
在熊猫中使数据透视表看起来更容易吗? 也许? also我们也可以将在聚合部分中学到的知识与组聚合一起使用。
Voila❕ These were the comparisons for 5 types of queries. Here is a bonus example where we combine some of the queries:
这些是对5种类型查询的比较。 这是一个奖励示例,其中我们结合了一些查询:

Thank you for reading my post. Hope you find these comparisons useful ✂️ and learned a bit more about pandas.
感谢您阅读我的帖子。 希望您发现这些比较有用useful️,并了解了更多有关熊猫的知识。
If you are interested to learn more about pandas, here are links to some of my posts:◼️️ 5 tips for pandas users◼️️ How to transform variables in a pandas DataFrame
如果你有兴趣更多地了解大熊猫,这里是链接到我的一些帖子:◼️️ 5个提示大熊猫用户◼️️如何在大熊猫变换变量数据帧
Bye for now 🏃💨
再见for
翻译自: https://towardsdatascience.com/writing-5-common-sql-queries-in-pandas-90b52f17ad76


 被折叠的 条评论
为什么被折叠?
被折叠的 条评论
为什么被折叠?
 到【灌水乐园】发言


