


啤酒瓶啤酒盖换啤酒
In this project, we aimed to identify one or more optimal locations to open a new brewery in the twin cities, Minneapolis and St. Paul, Minnesota. As there already exists a vibrant community of small, independent breweries in the area, we looked for locations that do not already have breweries nearby. Additionally, we thought it to be advantageous for breweries to be in close proximity to restaurants, as a possible destination for diners to meet before or after a meal. Hence we also analyzed restaurant density in proximity to the brewery locations and attempted to identify areas with few breweries but high restaurant density. Our conclusions will be based primarily on proximity to restaurants and existing breweries. We sought to identify areas distant from the nearest breweries, with many restaurants nearby. Our approach and results were data driven, and we concluded with suggestions for the best possible areas to open a new brewery or taproom in the twin cities.
在此项目中,我们旨在确定一个或多个最佳位置,以便在明尼阿波利斯和明尼苏达州圣保罗的两个城市开设一家新啤酒厂。 由于该地区已经有一个充满活力的小型独立啤酒厂社区,因此我们寻找附近没有啤酒厂的地点。 此外,我们认为对于酿酒厂来说,靠近餐厅是有利的,因为它是食客用餐前或饭后聚会的可能目的地。 因此,我们还分析了靠近啤酒厂位置的餐厅密度,并试图确定啤酒厂少但餐厅密度高的区域。 我们的结论将主要基于附近的餐馆和现有啤酒厂。 我们试图确定离最近的啤酒厂较远的区域,附近有许多餐馆。 我们的方法和结果是由数据驱动的,最后我们提出了在两个城市中最好的地区开设新的啤酒厂或茶水间的建议。
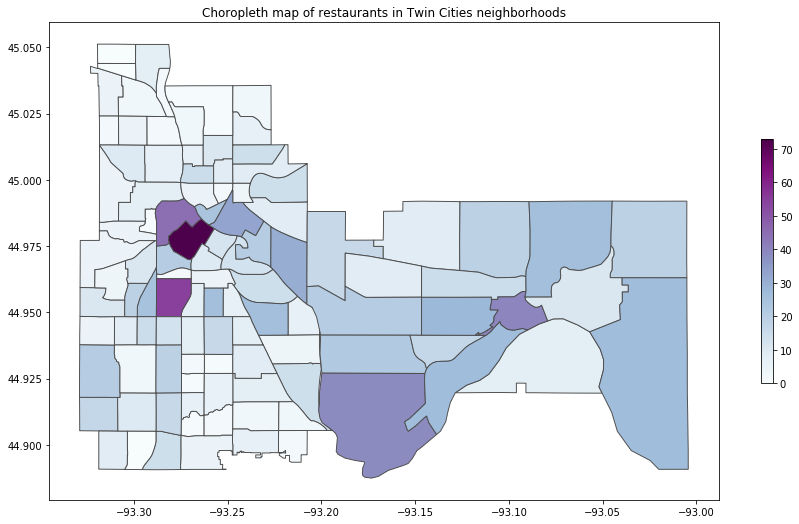
We gathered json files with neighborhood boundary data for the twin cities, and we called the Foursquare API to gather data about restaurant and brewery venues in the twin cities. The data was cleaned and formatted into a dataframe, and several new features were introduced, such as the number of restaurants/breweries in a fixed radius from each venue and the distance to the nearest brewery. With this information, we created choropleth maps of the restaurant and brewery densities by neighborhood, and we applied machine learning to cluster the data.
我们收集了包含两个城市的邻域边界数据的json文件,并调用了Foursquare API来收集有关两个城市中餐厅和啤酒厂场所的数据。 数据被清洗并格式化为数据框,并引入了一些新功能,例如距每个场所固定半径的餐馆/酿酒厂的数量以及距最近啤酒厂的距离。 利用这些信息,我们按邻域创建了餐厅和啤酒厂密度的区域地图,并应用了机器学习来对数据进行聚类。
We used two unsupervised clustering algorithms to group the restaurants and breweries, k-means and DBSCAN. Each method has advantages and disadvantages. K-means is an iterative algorithm that puts each venue (observation) into a cluster. In this algorithm, each observation is a part of a cluster; there are no outliers. The number of clusters is determined before running the algorithm. On the other hand, DBSCAN (density-based spatial clustering of applications with noise) looks for density-based clusters; i.e. clusters where observations within the cluster are ‘close’ to one another with regards to some metric. This algorithm does not cluster all observations; some are left as outliers. Additionally, the number of clusters is an output of the algorithm. Two key parameters are specified before running the algorithm, eps and min_samples. The eps parameter represents a radius centered about each venue, and min_samples represents the minimum number of observations that must be contained within the epsilon ball in order for that observation to be considered a core point. Neighboring core points and their neighbors are then grouped as clusters.
我们使用了两种无监督的聚类算法将餐馆和啤酒厂k-means和DBSCAN分组。 每种方法都有优点和缺点。 K均值是一种迭代算法,可将每个场所(观测)放入一个群集中。 在这种算法中,每个观察值都是集群的一部分; 没有异常值。 在运行算法之前确定簇数。 另一方面,DBSCAN(带有噪声的应用程序的基于密度的空间聚类)正在寻找基于密度的聚类。 也就是说,在某个度量标准上,集群中的观测值彼此“接近”的集群。 该算法不会将所有观察结果聚类; 一些被作为离群值。 另外,簇的数量是该算法的输出。 在运行算法之前,指定了两个关键参数,eps和min_samples。 eps参数代表以每个场所为中心的半径,min_samples代表必须包含在epsilon球中的最小观察数,以便将该观察视为核心点。 然后将相邻的核心点及其邻居分组为群集。
Below we present some of the DBSCAN cluster analysis.
下面我们介绍一些DBSCAN聚类分析。
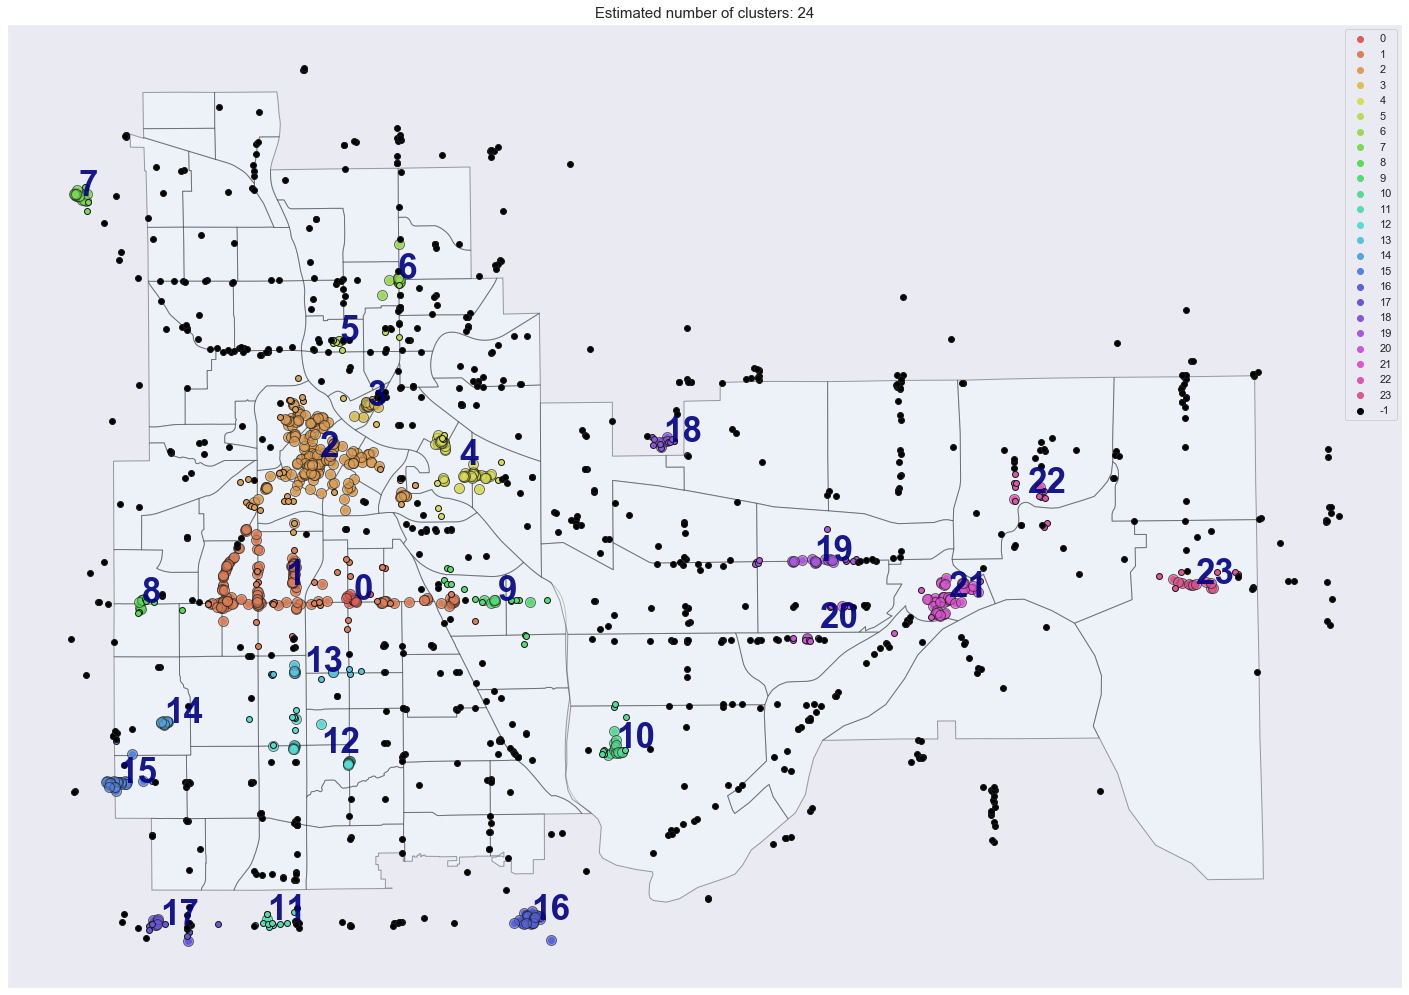
Running DBSCAN produced 24 clusters. We ignored those outside the boundaries of the cities and looked at the remaining 19. First we looked at the size of each cluster.
运行DBSCAN产生了24个集群。 我们忽略了城市边界以外的地区,而查看了其余的19个地区。首先,我们查看了每个集群的规模。
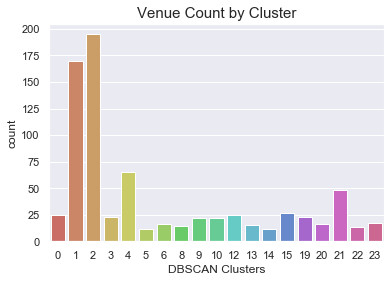
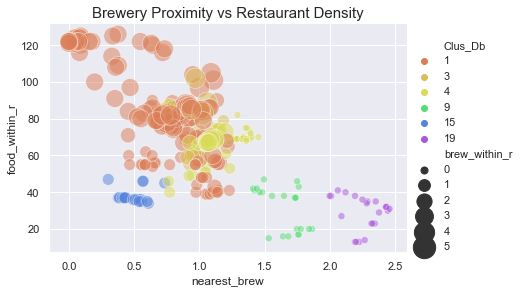
We see clusters 1 and 2 far larger than the others, corresponding to the Uptown/Lake Street and Downtown areas, respectively. Clusters 4 and 21 also include at least 25 more venues than most of the others. Next we looked at restaurant density. We calculated this feature by determining the number of restaurants within a 1.25 km radius of each venue. In the plot below, we see this value plotted on the vertical axis, grouped by cluster. The hue goes from dark to light for few breweries nearby to many breweries nearby.
我们看到群集1和2远远大于其他群集,分别对应于上城区/湖街和市区。 集群4和21还包括比其他大多数场所多25个场所。 接下来,我们看看餐厅的密度。 我们通过确定每个场所1.25公里半径内的餐馆数量来计算此功能。 在下面的图中,我们看到此值绘制在垂直轴上,按聚类分组。 对于附近的少数啤酒厂到附近的许多啤酒厂,色相从暗到亮。
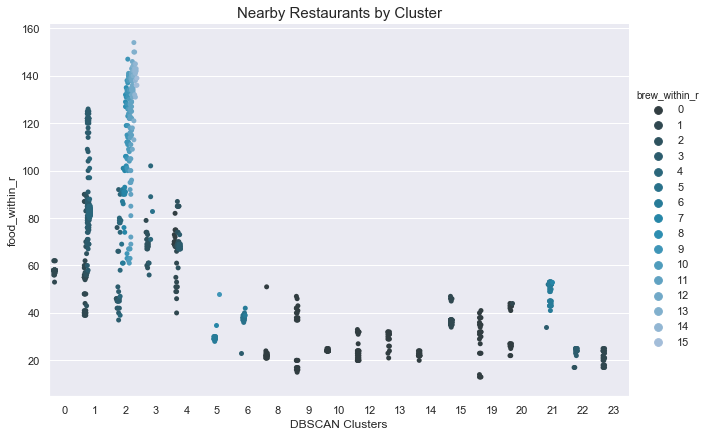
From the above plot, we see a high density of restaurants in cluster 1, with few breweries nearby. In contrast, we see cluster 2 also has a high restaurant density, but many venues additionally are in a high brewery density area as well. Cluster 4 has a healthy restaurant density, with few breweries within radius. There are a several clusters such as 9, 10, 12, or 19 that do not have a brewery within the 1.25 km radius. We identified clusters 1, 3, 4, 9, 15, and 19 as good candidates to look into further.
从上图可以看出,集群1中的餐厅密度很高,附近没有啤酒厂。 相比之下,我们看到群集2的餐厅密度也很高,但是许多场所也都位于啤酒密度较高的区域。 集群4的餐厅密度很高,半径范围内很少有啤酒厂。 有几个集群,例如9、10、12或19,在1.25公里半径内没有啤酒厂。 我们确定了群集1、3、4、9、15和19是可以进一步研究的良好候选者。
From the above plot, we see cluster 15 and 19 have similar restaurant density, and are each more than 1.25 km away from the nearest brewery. Cluster 19 has an extra half kilometer separation from the nearest brewery, and is a preferable candidate to 15 based off our criteria. Similarly, we can eliminate cluster 15. That leaves clusters 1, 3, 4, and 19.
从上面的图中可以看出,群集15和19的餐厅密度相似,并且距离最近的啤酒厂都超过1.25公里。 第19组与最近的啤酒厂相隔半公里,根据我们的标准,第15组是更可取的候选者。 类似地,我们可以消除簇15。剩下簇1、3、4和19。
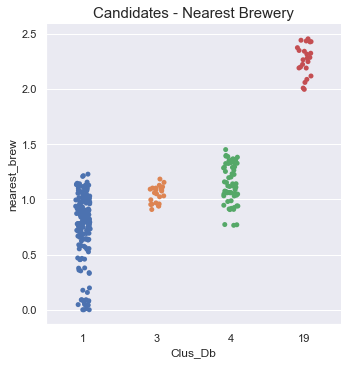
The restaurant numbers for clusters 1, 3, 4, and 19 are 167, 23, 65, and 23 respectively. Cluster 1 contains many venue restaurants, but only 3 breweries. Cluster 3 is about the same distance away from the nearest brewery, but has almost three times as many restaurants. Cluster 19 is the same size as cluster 3, but a full kilometer further away from the nearest brewery.
群集1、3、4和19的饭店编号分别为167、23、65和23。 群集1包含许多场馆餐厅,但只有3个啤酒厂。 群集3与最近的啤酒厂的距离大致相同,但是餐馆的数量几乎是后者的三倍。 组19的大小与组3的大小相同,但是距离最近的啤酒厂相距整整一公里。
We recommended cluster 4 as the best place that balances high restaurant numbers and distance from competition. This cluster comprised of the restaurants near and around the University of Minnesota. There are no immediate breweries in this area, and ‘tapping’ into the large population of students, researchers, faculty and staff would be a worthy investment.
我们建议第4组是平衡高餐厅数量和远离竞争的最佳地点。 这个集群由明尼苏达大学附近的餐馆组成。 该地区没有直接的啤酒厂,而“挖掘”大量学生,研究人员,教职员工将是值得的投资。
This report was submitted in partial fulfillment of the Applied Data Science Capstone, part of the IBM Data Science Professional Certificate on Coursera.org. It was a joy to work on this project, confronting and overcoming challenges along the way, and I’m happy to have a finished product.
提交此报告是为了部分满足Applied Data Science Capstone的要求,Appstone是Coursera.org上IBM数据科学专业证书的一部分。 从事此项目很高兴,在此过程中面临并克服了挑战,我很高兴有一个成品。
翻译自: https://medium.com/@no50free/beer-here-or-there-61a8937c2791
啤酒瓶啤酒盖换啤酒


 562
562

 被折叠的 条评论
为什么被折叠?
被折叠的 条评论
为什么被折叠?
 到【灌水乐园】发言


