


今天跟大家分享的是R绘制气泡图的代码。
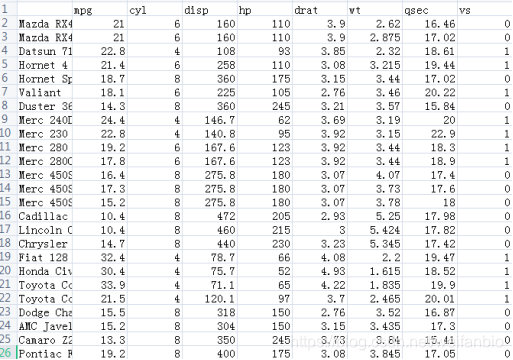
数据长这样:
mtcars.csv
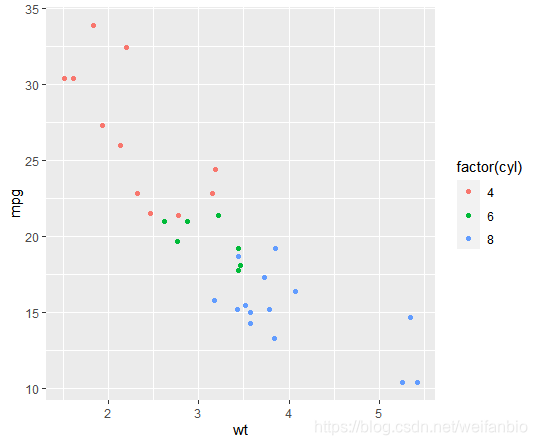
1.先使用ggplot2包绘制散点图(之前有分享过散点图绘制代码);
library(ggplot2)

ggplot(mtcars, aes(wt, mpg))+
  geom_point(aes(colour = factor(cyl)))
2.接着来绘制气泡图;
df <- data.frame(year=rep(c(2017,2018),3),
                 product=rep(c('ProductA','ProductB','ProductC'),2),
                 ratio=runif(6, min = 0, max = 1))

df <- df[order(df$year),]
df <- within(df,{

   bubblesize<- sqrt(df$ratio*10/pi)})
df$product <- factor(df$product,levels=unique
最低0.47元/天 解锁文章


 被折叠的 条评论
为什么被折叠?
被折叠的 条评论
为什么被折叠?
 到【灌水乐园】发言


