import numpy as np
import matplotlib.pyplot as plt
'''
案例一
data = np.arange(0, 1.1, 0.01)
plt.title("lines") # 添加标题
plt.xlabel("x") # 添加x轴的标签
plt.ylabel("y") # 添加y轴的标签
plt.xticks([0, 0.2, 0.4, 0.6, 0.8, 1]) # 规定x轴刻度
plt.yticks([0, 0.2, 0.4, 0.6, 0.8, 1]) # 规定y轴刻度
plt.plot(data, data**2) # 添加y=x^2曲线
plt.plot(data, data**4) # 添加y=x^4曲线
plt.legend(['y=x^2', 'y=x^4']) # 添加图例
plt.savefig("d:/图例.jpg") # 将图片保存到磁盘
plt.show() # 展示图例
'''
案例二
plt.rcParams["font.sans-serif"] = ["SimHei"]
plt.rcParams["axes.unicode_minus"] = False
x = np.arange(0, np.pi*2, 0.01)
p1 = plt.figure(figsize=(8, 6), dpi=80)
ax1 = p1.add_subplot(2, 1, 1)
plt.title("图像曲线图")
plt.xlabel('x')
plt.ylabel('y')
plt.xlim((0, 1))
plt.ylim((0, 1))
plt.xticks([0, 0.2, 0.4, 0.6, 0.8, 1])
plt.yticks([0, 0.2, 0.4, 0.6, 0.8, 1])
plt.plot(x, x**2)
plt.plot(x, x**4)
plt.legend(['y=x^2', 'y=x^4'])
ax1 = p1.add_subplot(2, 1, 2)
plt.title("sin/cos(x)")
plt.xlabel('x')
plt.ylabel('y')
plt.xlim((0, np.pi*2))
plt.ylim((-1, 1))
plt.xticks([0, np.pi/2, np.pi, np.pi*1.5, np.pi*2])
plt.yticks([-1, -0.5, 0, 0.5, 1])
plt.plot(x, np.sin(x))
plt.plot(x, np.cos(x))
plt.legend(['y=sin(x)', 'y=cos(x)'])
plt.tight_layout()
plt.savefig('D:/曲线图.jpg')
plt.show()
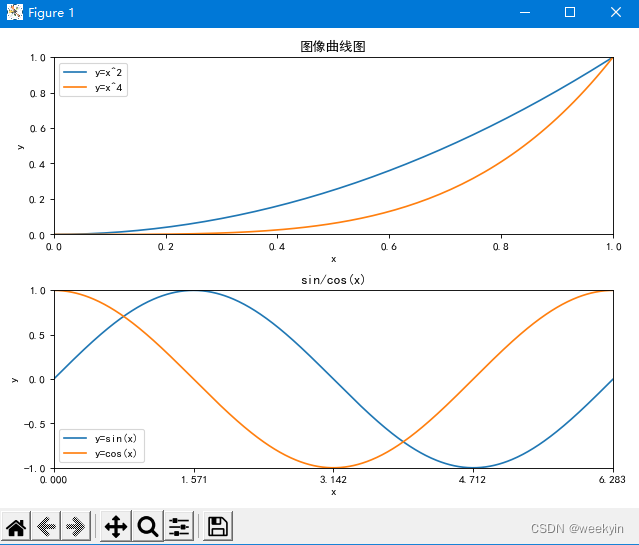


 该文展示了如何使用Python的matplotlib库进行数据可视化,包括创建带有图例的y=x^2和y=x^4曲线图,以及绘制包含sin(x)和cos(x)的子图,同时解决了中文乱码问题。


&spm=1001.2101.3001.5002&articleId=130738751&d=1&t=3&u=807c3829250649e08bf3d0595836fd5a)
 4065
4065

 被折叠的 条评论
为什么被折叠?
被折叠的 条评论
为什么被折叠?
 到【灌水乐园】发言


