


文章来源 https://github.com/brianfrankcooper/YCSB/wiki/Running-a-Workload
安装包下载
链接:https://pan.baidu.com/s/1GBBtCdj4ArRiQA1DV3o-Rg 密码:yvv2
关键:hbase 创建空表 create 'usertable',{NMAE=>'f1'}
使用ycsb的脚本会根据配置的脚本,选择插入的数据量和读写的比例,之后会生成一个报告,关于读写的时间,平均时间,等等指标。
第一步生产数据
第二步测试
上面参数含义:
- hbase-10 说明测试的是针对hbase1.x版本
- -p columnfamily=cf 插入hbase的列簇cf
- -p recordcount=100000000 总计插入1亿条数据 【可选】
- -jvm-args '-Xms2048m -Xmx2048m -XX:PermSize=128m -XX:MaxPermSize=256m' 设置JVM参数【可选】
- -p threadcount=100 客户端线程数为100,并发100【可选】
- -s load.dat 记录测试结果到 load.dat
- -P workloads/workloada 采用默认配置workloads/workloada,里面设置了插入占比50%,更新占比50%,默认往cf列簇插入10个列的数据,每个列的数据大小为100bytes,10个列的话总计大约1K大小数据
全文如下:
Running a Workload
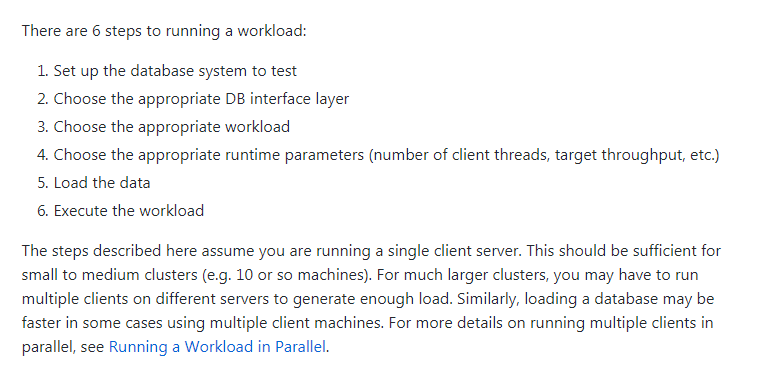
Step 1. Set up the database system to test
The first step is to set up the database system you wish to test. This can be done on a single machine or a cluster, depending on the configuration you wish to benchmark.
You must also create or set up tables/keyspaces/storage buckets to store records. The details vary according to each database system, and depend on the workload you wish to run. Before the YCSB Client runs, the tables must be created, since the Client itself will not request to create the tables. This is because for some systems, there is a manual (human-operated) step to create tables, and for other systems, the table must be created before the database cluster is started.
The tables that must be created depends on the workload. For CoreWorkload, the YCSB Client will assume that there is a "table" called "usertable" with a flexible schema: columns can be added at runtime as desired. This "usertable" can be mapped into whatever storage container is appropriate. For example, in MySQL you would "CREATE TABLE," in Cassandra you would define a keyspace in the Cassandra configuration, and so on. The database interface layer (described in step 2) will receive requests for reading or writing records in "usertable" and translate them into requests for the actual storage you have allocated. This may mean that you have to provide information for the database interface layer to help it understand what the structure of the underlying storage is. For example, in Cassandra, you must define "column families" in addition to keyspaces. Thus, it is necessary to create a column family and give the family some name (for example, you might use "values.") Then, the database access layer will need to know to refer to the "values" column family, either because the string "values" is passed in as a property, or because it is hardcoded in the database interface layer.
Step 2. Choose the appropriate DB interface layer
The DB interface layer is a java class that execute read, insert, update, delete and scan calls generated by the YCSB Client into calls against your database's API. This class is a subclass of the abstract DB class in the com.yahoo.ycsb package. You will specify the class name of the layer on the command line when you run YCSB Client, and the Client will dynamically load your interface class. Any properties specified on the command line, or in parameter files specified on the command line, will be passed to the DB interface instance, and can be used to configure the layer (for example, to tell it the hostname of the database you are benchmarking).
The YCSB Client is distributed with a simple dummy interface layer, com.yahoo.ycsb.BasicDB. This layer just prints the operations it would have executed to System.out. It can be useful for ensuring that the client is operating properly, and for debugging your workloads.
See Using the Database Libraries for details on how to use the clients while running YCSB. For more details about implementing a DB interface layer, see Adding a Database.
You can run commands directly against the database using the ycsb command. This client uses the DB interface layer to send commands to the database. You can use this client to make sure that the DB layer is working properly, that your database is set up correctly, that the DB layer can connect to the database, and so on. It also provides a common interface for a variety of databases, and can be used to inspect data in the database. To run the command line client:
$ ./bin/ycsb shell basic > help Commands: read key [field1 field2 ...] - Read a record scan key recordcount [field1 field2 ...] - Scan starting at key insert key name1=value1 [name2=value2 ...] - Insert a new record update key name1=value1 [name2=value2 ...] - Update a record delete key - Delete a record table [tablename] - Get or [set] the name of the table quit - Quit
Step 3. Choose the appropriate workload
The workload defines the data that will be loaded into the database during the loading phase, and the operations that will be executed against the data set during the transaction phase.
Typically, a workload is a combination of:
- Workload java class (subclass of com.yahoo.ycsb.Workload)
- Parameter file (in the Java Properties format)
Because the properties of the dataset must be known during the loading phase (so that the proper kind of record can be constructed and inserted) and during the transaction phase (so that the correct record ids and fields can be referred to) a single set of properties is shared among both phases. Thus the parameter file is used in both phases. The workload java class uses those properties to either insert records (loading phase) or execute transactions against those records (transaction phase). The choice of which phase to run is based on a parameter you specify when you run the ycsb command.
You specify both the java class and the parameter file on the command line when you run the YCSB Client. The Client will dynamically load your workload class, pass it the properties from the parameters file (and any additional properties specified on the command line) and then execute the workload. This happens both for the loading and transaction phases, as the same properties and workload logic applies to both. For example, if the loading phase creates records with 10 fields, then the transaction phase must know that there are 10 fields it can query and modify.
The CoreWorkload is a package of standard workloads that is distributed with the YCSB and can be used directly. In particular, the CoreWorkload defines a simple mix of read/insert/update/scan operations. The relative frequency of each operation is defined in the parameter file, as are other properties of the workload. Thus, by changing the parameter file, a variety of different concrete workloads can be executed. For more details on the CoreWorkload, see Core Workloads.
If the CoreWorkload does not satisfy your needs, you can define your own workload by subclassing the com.yahoo.ycsb.Workload class. Details for doing this are Implementing New Workloads.
Step 4. Choose the appropriate runtime parameters
Although the workload class and parameters file define a specific workload, there are additional settings that you may want to specify for a particular run of the benchmark. These settings are provided on the command line when you run the YCSB client. These settings are:
- -threads : the number of client threads. By default, the YCSB Client uses a single worker thread, but additional threads can be specified. This is often done to increase the amount of load offered against the database.
- -target : the target number of operations per second. By default, the YCSB Client will try to do as many operations as it can. For example, if each operation takes 100 milliseconds on average, the Client will do about 10 operations per second per worker thread. However, you can throttle the target number of operations per second. For example, to generate a latency versus throughput curve, you can try different target throughputs, and measure the resulting latency for each.
- -s : status. for a long running workload, it may be useful to have the Client report status, just to assure you it has not crashed and to give you some idea of its progress. By specifying "-s" on the command line, the Client will report status every 10 seconds to stderr.
Step 5. Load the data
Workloads have two executable phases: the loading phase (which defines the data to be inserted) and the transactions phase (which defines the operations to be executed against the data set). To load the data, you run the YCSB Client and tell it to execute the loading section.
For example, consider the benchmark workload A (more details about the standard workloads are in Core Workloads). To load the standard dataset:
$ ./bin/ycsb load basic -P workloads/workloada
A few notes about this command:
- The load parameter tells the Client to execute the loading section of the workload.
- The basic parameter tells the Client to use the dummy BasicDB layer. You can also specify this as a property in your parameters file using the "db" property (for example, "db=com.yahoo.ycsb.BasicDB").
- The "-P" parameter is used to load property files. In this case, we used it to load the workloada parameter file.
To load the HBase dataset:
$ ./bin/ycsb load hbase -P workloads/workloada -p columnfamily=family
A few notes about this command:
- The load parameter tells the Client to execute the loading section of the workload.
- The hbase parameter tells the Client to use the HBase layer.
- The -P parameter is used to load property files. In this case, we used it to load the workloada parameter file.
- The -p parameter is used to set parameter. In this HBase case, we used it to set database column. You should have database usertable with column family before running this command. Then all data will be loaded into database usertable with column family.
- Make sure you have already started Hadoop and HBase before you run this command.
If you used BasicDB, you would see the insert statements for the database. If you used a real DB interface layer, the records would be loaded into the database.
The standard workload parameter files create very small databases; for example, workloada creates only 1,000 records. This is useful while debugging your setup. However, to run an actual benchmark you'll want to generate a much larger database. For example, imagine you want to load 100 million records. Then, you will need to override the default "recordcount" property in the workloada file. This can be done in one of two ways:
- Specifying a new property file containing a new value of recordcount. If this file is specified on the command line after the workloada file, it will override any properties in workloada. For example, create a file called "large.dat" with the single line:
recordcount=100000000
Then, run the client as follows:
$ ./bin/ycsb load basic -P workloads/workloada -P large.dat
The client will load both property files, but will use the value of recordcount from the last file it loaded, e.g. large.dat.
- Specify a new value of the recordcount property on the command line. Any properties specified on the command line override properties specified in property files. In this case, run the client as follows:
$ ./bin/ycsb load basic -P workloads/workloada -p recordcount=100000000
In general, it is good practice to store any important properties in new parameter files, instead of specifying them on the command line. This makes your benchmark results more reproducible; instead of having to reconstruct the exact command line you used, you just reuse the property files. Note, however, that the YCSB Client will print out its command line when it begins executing, so if you store the output of the client in a data file, you can retrieve the command line from that file.
Because a large database load will take a long time, you may wish to 1. require the Client to produce status, and 2. direct any output to a datafile. Thus, you might execute the following to load your database:
$ ./bin/ycsb load basic -P workloads/workloada -P large.dat -s > load.dat
The -s parameter will require the Client to produce status report on stderr. Thus, the output of this command might be:
$ ./bin/ycsb load basic -P workloads/workloada -P large.dat -s > load.dat Loading workload... (might take a few minutes in some cases for large data sets) Starting test. 0 sec: 0 operations 10 sec: 61731 operations; 6170.6317473010795 operations/sec 20 sec: 129054 operations; 6450.76477056883 operations/sec ...
This status output will help you to see how quickly load operations are executing (so you can estimate the completion time of the load) as well as verify that the load is making progress. When the load completes, the Client will report statistics about the performance of the load. These statistics are the same as in the transaction phase, so see below for information on interpreting those statistics.
Step 6: Execute the workload
Once the data is loaded, you can execute the workload. This is done by telling the client to run the transaction section of the workload. To execute the workload, you can use the following command:
$ ./bin/ycsb run basic -P workloads/workloada -P large.dat -s > transactions.dat
The main difference in this invocation is that we used the run parameter to tell the Client to use the transaction section instead of the loading section. If you used BasicDB, and examine the resulting transactions.dat file, you will see a combination of read and update requests, as well as statistics about the execution.
Typically you will want to use the -threads and -target parameters to control the amount of offered load. For example, we might want 10 threads attempting a total of 100 operations per second (e.g. 10 operations/sec per thread.) As long as the average latency of operations is not above 100 ms, each thread will be able to carry out its intended 10 operations per second. In general, you need enough threads so that no thread is attempting more operations per second than is possible, otherwise your achieved throughput will be less than the specified target throughput. For this example, we can execute:
$ ./bin/ycsb run basic -P workloads/workloada -P large.dat -s -threads 10 -target 100 > transactions.dat
Note in this example we have used the -threads 10 command line parameter to specify 10 threads, and -target 100 command line parameter to specify 100 operations per second as the target. Alternatively, both values can be set in your parameters file using the threadcount and target properties respectively. For example:
threadcount=10 target=100
At the end of the run, the Client will report performance statistics on stdout. In the above example, these statistics will be written to the transactions.dat file. The default is to produce average, min, max, 95th and 99th percentile latency for each operation type (read, update, etc.), a count of the return codes for each operation, and a histogram of latencies for each operation. The return codes are defined by your database interface layer, and allow you to see if there were any errors during the workload. For the above example, we might get output like:
[OVERALL],RunTime(ms), 10110 [OVERALL],Throughput(ops/sec), 98.91196834817013 [UPDATE], Operations, 491 [UPDATE], AverageLatency(ms), 0.054989816700611 [UPDATE], MinLatency(ms), 0 [UPDATE], MaxLatency(ms), 1 [UPDATE], 95thPercentileLatency(ms), 1 [UPDATE], 99thPercentileLatency(ms), 1 [UPDATE], Return=0, 491 [UPDATE], 0, 464 [UPDATE], 1, 27 [UPDATE], 2, 0 [UPDATE], 3, 0 [UPDATE], 4, 0 ...
This output indicates:
- The total execution time was 10.11 seconds
- The average throughput was 98.9 operations/sec (across all threads)
- There were 491 update operations, with associated average, min, max, 95th and 99th percentile latencies
- All 491 update operations had a return code of zero (success in this case)
- 464 operations completed in less than 1 ms, while 27 completed between 1 and 2 ms.
Similar statistics are available for the read operations.
While a histogram of latencies is often useful, sometimes a timeseries is more useful. To request a time series, specify the "measurementtype=timeseries" property on the Client command line or in a properties file. By default, the Client will report average latency for each interval of 1000 milliseconds. You can specify a different granularity for reporting using the "timeseries.granularity" property. For example:
$ ./bin/ycsb run basic -P workloads/workloada -P large.dat -s -threads 10 -target 100 -p \ measurementtype=timeseries -p timeseries.granularity=2000 > transactions.dat
will report a timeseries, with readings averaged every 2,000 milliseconds (e.g. 2 seconds). The result will be:
[OVERALL],RunTime(ms), 10077 [OVERALL],Throughput(ops/sec), 9923.58836955443 [UPDATE], Operations, 50396 [UPDATE], AverageLatency(ms), 0.04339630129375347 [UPDATE], MinLatency(ms), 0 [UPDATE], MaxLatency(ms), 338 [UPDATE], Return=0, 50396 [UPDATE], 0, 0.10264765784114054 [UPDATE], 2000, 0.026989343690867442 [UPDATE], 4000, 0.0352882703777336 [UPDATE], 6000, 0.004238958990536277 [UPDATE], 8000, 0.052813085033008175 [UPDATE], 10000, 0.0 [READ], Operations, 49604 [READ], AverageLatency(ms), 0.038242883638416256 [READ], MinLatency(ms), 0 [READ], MaxLatency(ms), 230 [READ], Return=0, 49604 [READ], 0, 0.08997245741099663 [READ], 2000, 0.02207505518763797 [READ], 4000, 0.03188493260913297 [READ], 6000, 0.004869141813755326 [READ], 8000, 0.04355329949238579 [READ], 10000, 0.005405405405405406
This output shows separate time series for update and read operations, with data reported every 2000 milliseconds. The data reported for a time point is the average over the previous 2000 milliseconds only. (In this case we used 100,000 operations and a target of 10,000 operations per second for a more interesting output). A note about latency measurements: the Client measures the end to end latency of executing a particular operation against the database. That is, it starts a timer before calling the appropriate method in the DB interface layer class, and stops the timer when the method returns. Thus latencies include: executing inside the interface layer, network latency to the database server, and database execution time. They do not include delays introduced for throttling the target throughput. That is, if you specify a target of 10 operations per second (and a single thread) then the Client will only execute an operation every 100 milliseconds. If the operation takes 12 milliseconds, then the client will wait for an additional 88 milliseconds before trying the next operation. However, the reported latency will not include this wait time; a latency of 12 milliseconds, not 100, will be reported.

 1026


 扫一扫


 被折叠的 条评论
为什么被折叠?
 到【灌水乐园】发言


