 Linux下用工具快速定位内存问题


在日常开发中,遇到段错误是很常见的事,其中一种情况 Out of memory(OOM),内存泄露问题一般不好查找,但是可以借助工具来快速定位。
这里介绍的工具是valgrind,这个工具在buildroot有提供,如下图,选中,然后重新编译
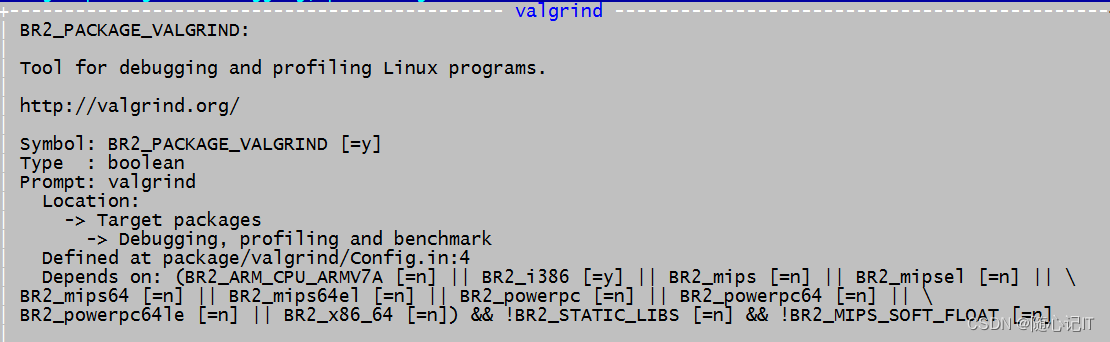
valgrind 工具
memcheck :检测程序中的内存问题,如内存泄漏,越界,非法指针等
callgrind:检测程序代码的运行时间和调用过程,以及分析程序性能。
cachegrind:分析CPU的cache命中率,丢失率,用于进行代码优化。
helgrind:用于检测多线程程序中出现的竞争问题
Massif:堆栈分析器,它能测量程序在堆栈中使用了多少内存,告诉我们堆块,堆管理和栈的大小。
先上个测试案例 1.c
#include <stdio.h>
#include <stdlib.h>
#include <string.h>

void main()
{
	char *p = malloc(1024);
	char *p1 = malloc(512);
	char buf[3] = {0};
	strcpy(buf,"1234");
	printf("buf==%s\n",buf);
	p = NULL;
	while(1);
}
这个例子在给两个指针分配内存后,p直接指向了NULL,程序退出。
编译程序:
gcc 1.c -g -o 1,其中-g是为了保留符号表,可以定位到代码中具体某一行
valgrind --tool=memcheck --leak-check=full --show-leak-kinds=all --undef-value-errors=no --log-file=1.log ./1
tool=memcheck 表示检测内存问题。
leak-check=full 表示完全检测内存泄漏
–log-file=log 表示信息会输入到log文件中(有时文件内容比较多,这样方便分析)
等程序退出或者通过kill 方式再查看log信息。
==17242== Memcheck, a memory error detector
==17242== Copyright (C) 2002-2015, and GNU GPL'd, by Julian Seward et al
最低0.47元/天 解锁文章


 686
686

 被折叠的 条评论
为什么被折叠?
被折叠的 条评论
为什么被折叠?
 到【灌水乐园】发言


