


 超级会员免费看
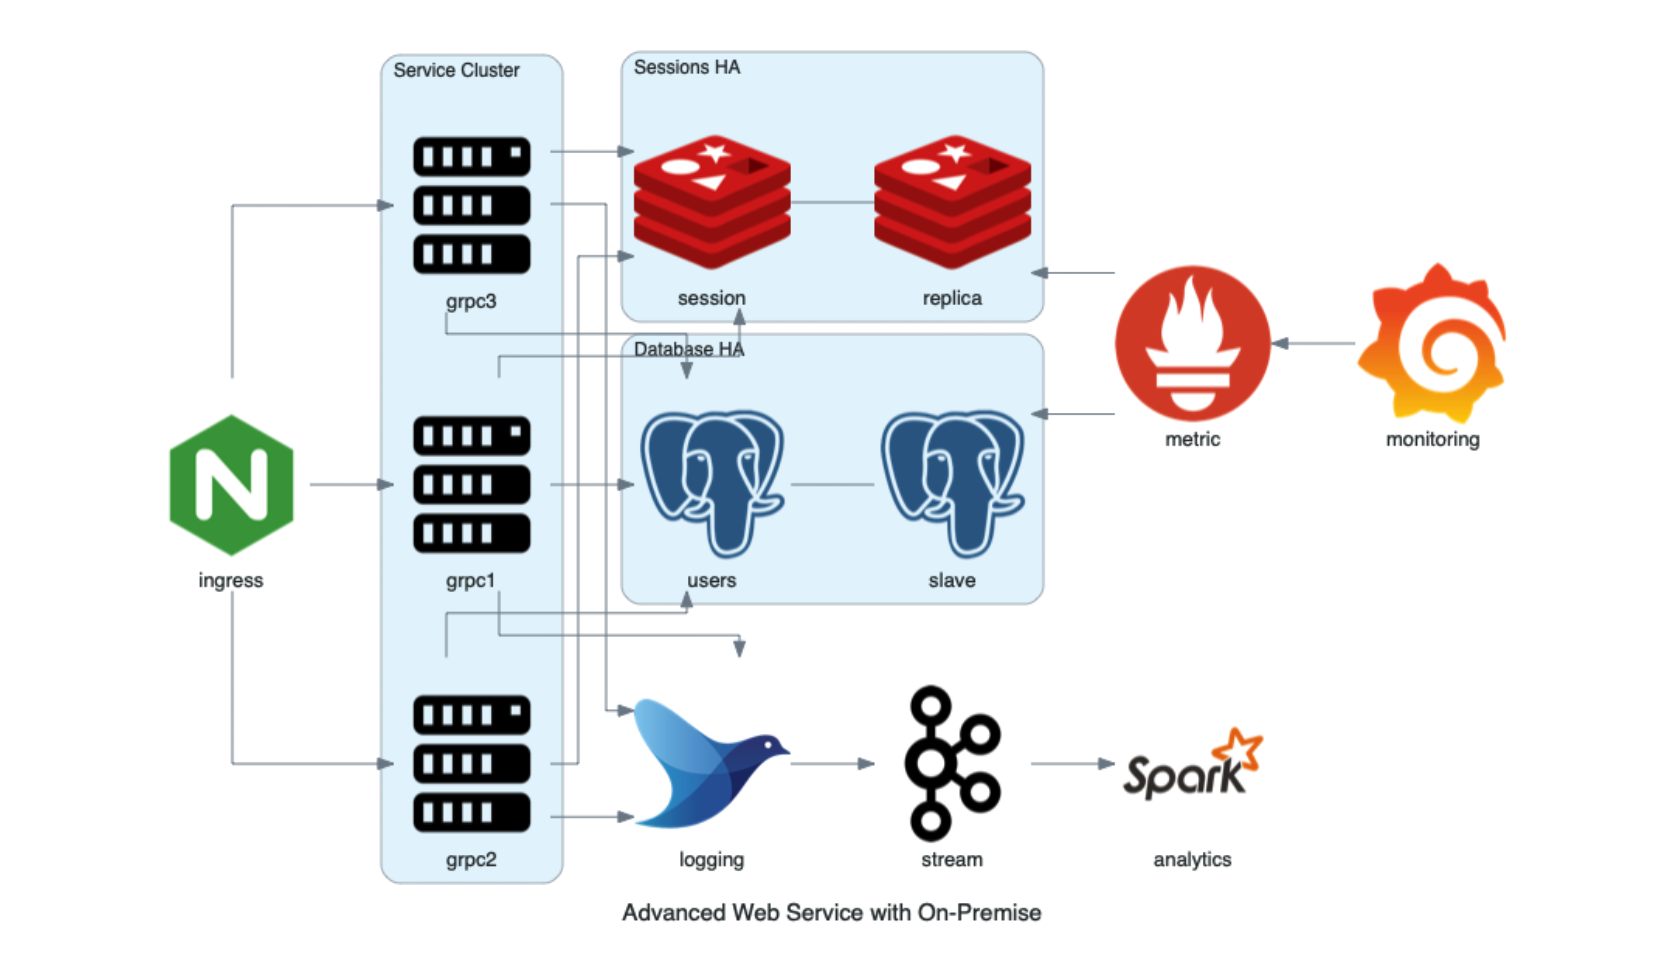
 Diagrams是一款用Python代码绘制云系统架构图的工具,支持多种主流云服务提供商和图表节点。通过Graphviz渲染,适用于原型设计和现有系统描述。安装Python 3.6+和Graphviz后,即可开始使用。本文档包含快速入门示例,指导如何绘制不同类型的架构图。
Diagrams
Diagram as Code.
Diagrams lets you draw the cloud system architecture in Python code. It was born for prototyping a new system architecture design without any design tools. You can also describe or visualize the existing system architecture as well. Diagrams currently supports main major providers including: AWS, Azure, GCP

 订阅专栏 解锁全文


 3432
3432

 被折叠的 条评论
为什么被折叠?
被折叠的 条评论
为什么被折叠?
 到【灌水乐园】发言


