from matplotlib import pyplot as plt
import matplotlib.ticker as mticker
import numpy as np
import matplotlib.patches as patches
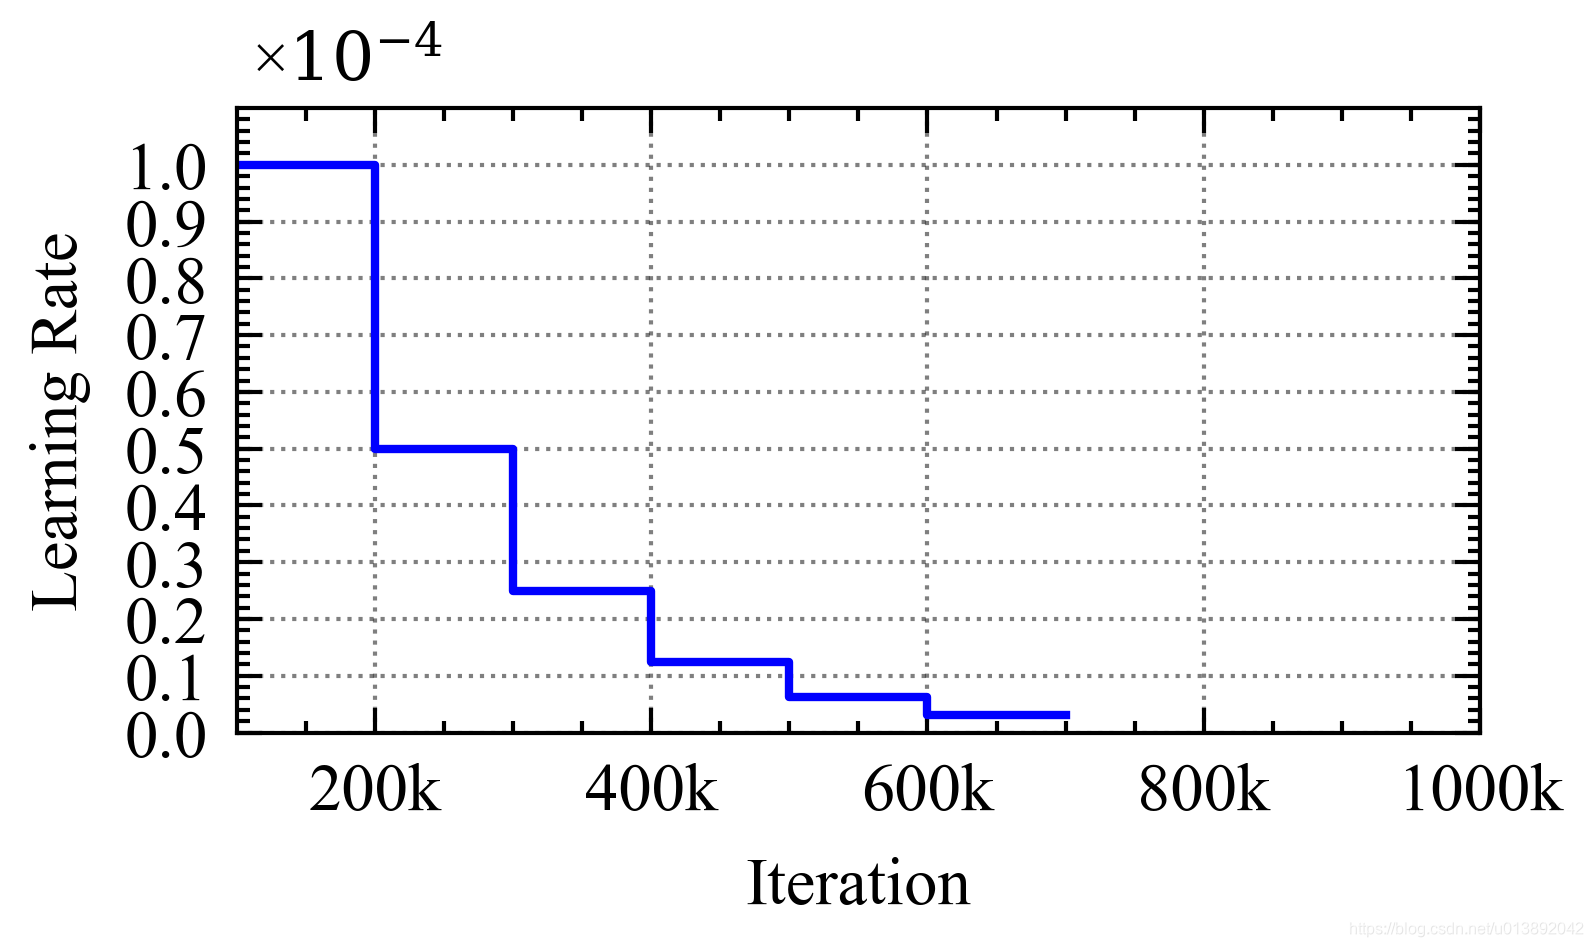
x = [0, 2,3,4,5,6,7]
y = [1.0,1.0, 0.5, 0.25, 0.125, 0.0625,0.03125]
with plt.style.context(['science','ieee','grid','no-latex']):
fig = plt.figure()
plt.ylim(0.0,1.1)
plt.xlim(1.0,10)
y_ticks = np.arange(0.0,1.1,0.1)
plt.yticks(y_ticks)
plt.gca().xaxis.set_major_formatter(mticker.FormatStrFormatter('%.0f00k'))
plt.step(x, y,'b', where="pre")
plt.text(1.1,1.15,'×$10^{-4}$')
plt.xlabel('Iteration')
plt.ylabel('Learning Rate')
plt.show()


 被折叠的 条评论
为什么被折叠?
被折叠的 条评论
为什么被折叠?
 到【灌水乐园】发言


