


 本文汇总了使用Matplotlib进行高效绘图的多种技巧,包括风格控制、坐标轴调整、颜色填充、边框控制、圆类图形绘制、图例调整、图片引入、散点图优化、图片内容保存、字体使用、网格线放置、坐标轴字体调整、多个图片共享颜色条、单独保存颜色条、字体整体控制、去除保存图片空白、直方图调整、坐标轴格式调整等内容。
20200813 -
引言
颜色、图标参考地址:
- Matplotlib 点、线形状及颜色
- python画图(标记、marker、设置标记大小、marker符号大全)(图文详细入门教程五)
- matplotlib颜色表
- Style sheets reference官网
- 不同风格的具体对比
各种图片的画廊
Top 50 matplotlib Visualizations – The Master Plots (with full python code)
这里记录以下关于绘图过程中,使用matplotlib时遇到的一些问题。
- 风格控制
- 修改坐标轴间距
- 区域内填充颜色
- 控制边框
- 圆类图形绘制
- 调整图例
- 引入其他图片
- 大量点的散点图
- 仅保存图片内容
- 字体使用
- 网格线放置在底层
- 调整坐标轴字体
- 多个图片共享颜色条
- 单独保存颜色条
- 字体整体控制
- 横线绘制,并添加具体数值
- 绘制直线并带有方差的带(band)
- 调整seaborn绘图中标号和线大小
- 解决seaborn绘图中图例无线风格的问题
- 调整直方图中各个形状的宽度
- 调整坐标轴数字格式
- How to zoomed a portion of image and insert in the same plot in matplotlib
问题
1. 风格控制
文章[1]中列举了一些风格控制的方式,不过这部分我一直没关注过,一直都是使用的默认风格。
一次使用过程中,在修改风格之后,希望还原最开始的风格,可以使用下面的命令。
matplotlib.rcdefaults()
2. 修改坐标轴间距
import matplotlib.pyplot as plt
from matplotlib.pyplot import MultipleLocator
#从pyplot导入MultipleLocator类,这个类用于设置刻度间隔

x_values=list(range(11))
y_values=[x**2 for x in x_values]
plt.plot(x_values,y_values,c='green')
plt.title('Squares',fontsize=24)
plt.tick_params(axis='both',which='major',labelsize=14)
plt.xlabel('Numbers',fontsize=14)
plt.ylabel('Squares',fontsize=14)
x_major_locator=MultipleLocator(1)
#把x轴的刻度间隔设置为1,并存在变量里
y_major_locator=MultipleLocator(10)
#把y轴的刻度间隔设置为10,并存在变量里
ax=plt.gca()
#ax为两条坐标轴的实例
ax.xaxis.set_major_locator(x_major_locator)
#把x轴的主刻度设置为1的倍数
ax.yaxis.set_major_locator(y_major_locator)
#把y轴的主刻度设置为10的倍数
plt.xlim(-0.5,11)
#把x轴的刻度范围设置为-0.5到11,因为0.5不满一个刻度间隔,所以数字不会显示出来,但是能看到一点空白
plt.ylim(-5,110)
#把y轴的刻度范围设置为-5到110,同理,-5不会标出来,但是能看到一点空白
plt.show()
具体见文章[2]。
3. 区域内填充颜色
类似于不规则形状中进行颜色的填充,matplotlib提供了三种API(我只看到这几种目前):
- fill
- fill_between
- fill_betweenx
第一种是给定点的坐标,然后多边形内进行颜色填充;另外两种是给定线然后进行填充。
具体见示例[3][4]。
4. 控制边框
前面提到了控制坐标轴(边框)间距内容,这里专门针对边框进行说明,首先是边框的可视化,这里有两种方案[5]:
plt.axis('off')
plt.xticks([])
plt.yticks([])
ax = plt.gca()
ax.spines['top'].set_visible(False)
ax.spines['bottom'].set_visible(False)
ax.spines['left'].set_visible(False)
ax.spines['right'].set_visible(False)
如果要设置边框线的粗细。
ax.spines['bottom'].set_linewidth('2.0')
关于其他的控制风格,可以查看文章[6]。
5.圆类图形绘制[7]
ell1 = Ellipse(xy = (0.0, 0.0), width = 4, height = 8, \
					angle = 30.0, facecolor= 'yellow', alpha=0.3)
cir1 = Circle(xy = (0.0, 0.0), radius=2, alpha=0.5)
ax.add_patch(ell1)
ax.add_patch(cir1)
以上分别是进行椭圆和圆形的绘制,其中椭圆的角度参数是360度调整的,上述代码已经经过了测试,可以运行。
6. 调整图例相关内容
7. 引入其他图片
之前这里的一个需求就是,将某个图片导入到框中,然后在图片上进行编辑,但是找了找都没找到相关的内容,还是在官网的代码上发现了内容[8],例如如果要显示一个图片。
import matplotlib.pyplot as plt
import matplotlib.cbook as cbook

# A sample image
with cbook.get_sample_data('grace_hopper.jpg') as image_file:
    image = plt.imread(image_file)

fig, ax = plt.subplots()
ax.imshow(image)
ax.axis('off')  # clear x-axis and y-axis
这个仅仅将图片显示,还有另外的示例可以查看。如果要将图片放置在某个位置可以参考问答[9]。
8. 大量点的散点图
在绘图过程中,如果含有大量的点,在将图片保存在pdf格式的时候,会导致图片加载特别慢,而且打开pdf文件的时候,会看到类似动画一样,点逐个显示出出来。这样的过程是正常的,毕竟要保存非常多点的信息,这样的pdf图片插入到论文中,会导致论文也加载特别慢。但是如果保存为类似png图片的话,那么很多其他的内容也会失真。一种解决方案就是在绘图的操作中加入参数rasterized = True,这样可以保证除了这些点其他元素,例如图例等依然是类似矢量图一样不失真[10]。
plt.scatter(test_points[:, 0], test_points[:, 1], alpha = 0.8,
                label = label[i], color = colors[i], s = 20, rasterized = True)
9. 仅保存图片内容
有时候,在保存图片的时候,在坐标轴旁边有大量的空白位置,这样插入图片的时候,就发现标题和图片内容相差太远。问答[11]给出了解决方案。其中一种是通过控制一些参数,这个方案没有尝试,而是尝试了另外一种方案。
fig.savefig('out.png', bbox_inches='tight', pad_inches=0)
这种方法在插入图例在图片外面的时候也尝试过;我觉得要懂得原理的话,还是要深入理解matploblib的原理,每部分都是什么作用。
10. 字体使用
- How to set the label Fonts as “Time New Roman” by drawparallels in python
- Matplotlib cannot find basic fonts
- 获取字体列表(可读形式显示)
在使用jupyter进行字体设置的时候,准备更换为“Time New Roman”,上面第一个虽然指出了如何设置,但是本质上还是需要linux系统的支持,首先从windows系统中找到字体,并传到相应位置,可以参考文章[17]。
然后再记得删除matplot的缓存
rm ~/.cache/matplotlib -rf
然后使用下面的命令全局设置即可:
plt.rcParams["font.family"] = "serif"
plt.rcParams["font.serif"] = ["Times New Roman"]
11. 网格线放置在底层
在默认情况下,绘制好了相关数据之后,采用命令plt.grid()可以添加网格,但是如果直接添加的话,可能会导致网格线出现在原来上面,就跟做PPT时候,对象在哪个层一样,解决方法[12]如下:
    ax.set_axisbelow(True)
    ax.yaxis.grid(color='gray', linestyle='dashed')
12. 调整坐标轴字体
具体见[13]。
import matplotlib.pyplot as plt
# We prepare the plot
fig, ax = plt.subplots()

# We change the fontsize of minor ticks label
ax.tick_params(axis='both', which='major', labelsize=10)
ax.tick_params(axis='both', which='minor', labelsize=8)
13. 多个图片共享颜色条
- Matplotlib 2 Subplots, 1 Colorbar
- How to Plot Only One Colorbar for Multiple Plot Using Matplotlib
在使用过程中,比较重要的是,参数vmax,vmin的设置,多个图片一定要设置一致,这样他们才能共享同一个颜色条。
14. 单独保存颜色条
之前的时候,涉及到单独保存图例,具体内容见《Matplotlib调整图例相关内容》。对于颜色条来说,大致思路思路是一样的,参考问答[14]。
import pylab as pl
import numpy as np

a = np.array([[0,1]])
pl.figure(figsize=(9, 1.5))
img = pl.imshow(a, cmap="Blues")
pl.gca().set_visible(False)
cax = pl.axes([0.1, 0.2, 0.8, 0.6])
pl.colorbar(orientation="h", cax=cax)
pl.savefig("colorbar.pdf")
得到如下结果。
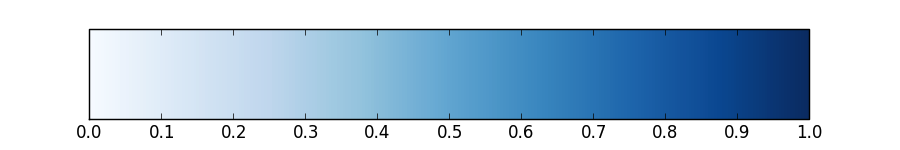
但是这里需要注意的是,pl.axes这个部分,之前的时候一直没有参考过这个内容,最近在绘图的时候发现这类的应用经常有,可能需要单独来学习学习,还有一些调整空间的。调试这部分内容的时候,并没有去看官方文档,而是直接自己调试了,调试的结果就是,前面两个参数是横纵坐标,应该是以图像大小为单位,然后比例大小。后面两个参数呢,分别是按两个方向扩展的大小,就是说按横纵方向以图像大小为比例扩展多少。
15. 字体整体控制
平时在控制字体大小的时候,都是在调用某个api之后,在参数中指定fontsize,这种方法,实际上控制起来比较困难,特别是要控制的内容比较多的时候。那么比较好的方法,如果已经知道自己就是要使用这样的大小,可以在全局部分进行控制。在问答[15]中给出了答案。
import matplotlib.pyplot as plt

SMALL_SIZE = 8
MEDIUM_SIZE = 10
BIGGER_SIZE = 12

plt.rc('font', size=SMALL_SIZE)          # controls default text sizes
plt.rc('axes', titlesize=SMALL_SIZE)     # fontsize of the axes title
plt.rc('axes', labelsize=MEDIUM_SIZE)    # fontsize of the x and y labels
plt.rc('xtick', labelsize=SMALL_SIZE)    # fontsize of the tick labels
plt.rc('ytick', labelsize=SMALL_SIZE)    # fontsize of the tick labels
plt.rc('legend', fontsize=SMALL_SIZE)    # legend fontsize
plt.rc('figure', titlesize=BIGGER_SIZE)  # fontsize of the figure title
16. 去除保存图片的空白
在使用plt.savefig的时候,如果不进行参数的数值,四周将会有大量的留白,平时如果只是用于查看,倒是无所谓,但是如果插入到论文里,会产生大量的边界。
plt.savefig("test.png",bbox_inches='tight')
之前都是采用上面这个命令,但是即使这样,还是稍微有点空白。插入到论文中,就比较明显了。在问答[16]中提到了相关的解决方案,就是上述这个命令,但是在后面的回答中,还提到了pad_inches = 0这个参数,经过测试,使用这个命令是可行的,但是如果有坐标边框的话,会导致这个边框的黑线被一半截断,适当增大这个参数可以进行调整,可以设置为0.02这样的参数,比较合理也比较美观,这样插入到论文中就没那么明显了。
20. 调整直方图bar宽度和位置
seaborn默认绘制的直方图的结果bar的宽度可能不太合适,所以需要修改。
import pylab as plt
import seaborn as sns

tips = sns.load_dataset("tips")
fig, ax = plt.subplots()

sns.barplot(data=tips, ax=ax, x="time", y="tip", hue="sex")

def change_width(ax, new_value) :
    for patch in ax.patches :
        current_width = patch.get_width()
        diff = current_width - new_value

        # we change the bar width
        patch.set_width(new_value)

        # we recenter the bar
        patch.set_x(patch.get_x() + diff * .5)

change_width(ax, .35)
plt.show()
以上命令是好使的,如果是横向的直方图,那么可以修改相应为get_height及get_y。
21. 调整坐标轴数据格式(十进制的科学计数法)
正常情况下,如果数值比较大,那么matplotlib会自动进行科学计数法,当然也可以对范围进行指定利用接口,matplotlib.pyplot.ticklabel_format。但是这样出来结果的形式是1e10的样子,我想要
1
×
1
0
4
1\times10^4
1×10⁴的样子。
搜索之后找到答案[16],代码如下:
import matplotlib.pyplot as plt
import numpy as np
import matplotlib.ticker as mticker

fig, ax = plt.subplots()

x = np.linspace(0, 300, 20)
y = np.linspace(0,300, 20)
y = y*1e16

ax.plot(x,y)

class MathTextSciFormatter(mticker.Formatter):
    def __init__(self, fmt="%1.2e"):
        self.fmt = fmt
    def __call__(self, x, pos=None):
        s = self.fmt % x
        decimal_point = '.'
        positive_sign = '+'
        tup = s.split('e')
        significand = tup[0].rstrip(decimal_point)
        sign = tup[1][0].replace(positive_sign, '')
        exponent = tup[1][1:].lstrip('0')
        if exponent:
            exponent = '10^{%s%s}' % (sign, exponent)
        if significand and exponent:
            s =  r'%s{\times}%s' % (significand, exponent)
        else:
            s =  r'%s%s' % (significand, exponent)
        return "${}$".format(s)

# Format with 2 decimal places
plt.gca().yaxis.set_major_formatter(MathTextSciFormatter("%1.2e"))

plt.show()
参考文章
[1]matplotlib–修改样式
[2]Python设置matplotlib.plot的坐标轴刻度间隔以及刻度范围
[3]Filling the area between lines
[4]How to fill an area in matplotlib ?
[5]Matplotlib去掉坐标轴
[6]Matplotlib绘图(一)-边框线及坐标轴的设置
[7]python绘制圆和椭圆
[8]Image Demo
[9]How to insert a small image on the corner of a plot with matplotlib?
[10]Figures with lots of data points in matplotlib
[11]scipy: savefig without frames, axes, only content
[12]Matplotlib: draw grid lines behind other graph elements
[13]Matplotlib make tick labels font size smaller
[14]Standalone colorbar (matplotlib)
[15]How to get a list of all the fonts currently available for Matplotlib?
[16]Show decimal places and scientific notation on the axis of a matplotlib plot
[17]findfont: Font family [‘Times New Roman‘] not found. Falling back to DejaVu Sans.字体安装


 被折叠的 条评论
为什么被折叠?
被折叠的 条评论
为什么被折叠?
 到【灌水乐园】发言


