


 本文介绍了使用Matplotlib库绘制子图的方法,并通过实例展示了如何设置子图布局、背景颜色等属性。此外还提供了多个子图绘制的例子,帮助读者更好地理解和掌握子图的绘制技巧。
____tz_zs
matplotlib.pyplot.subplot(*args, **kwargs)
返回一个指定子图分布的网格位置的 figure 对象。
参数:
subplot(nrows, ncols, index, **kwargs)
分别指定 (行数,列数,位置)
其他参数:
- facecolor: 背景色
- polar: 是否用极坐标投影
- projection: 投影
官网示例代码:
import matplotlib.pyplot as plt
# plot a line, implicitly creating a subplot(111)
plt.plot([1,2,3])
# now create a subplot which represents the top plot of a grid
# with 2 rows and 1 column. Since this subplot will overlap the
# first, the plot (and its axes) previously created, will be removed
plt.subplot(211)
plt.plot(range(12))
plt.subplot(212, facecolor='y') # creates 2nd subplot with yellow background
.
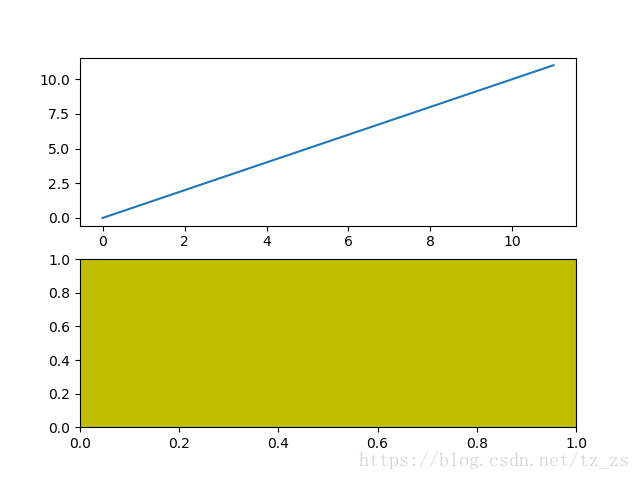
.
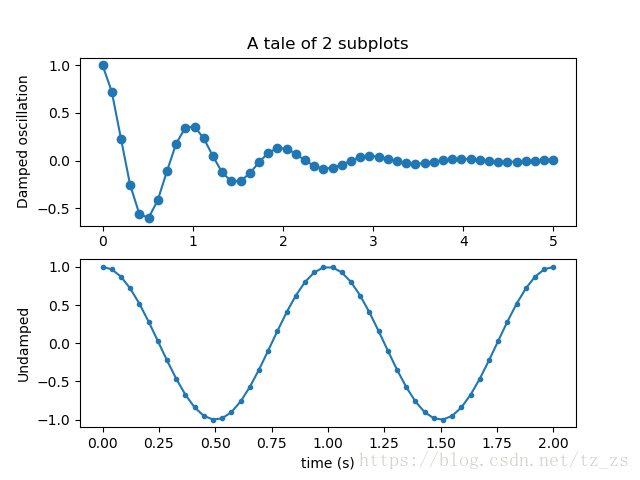
#!/usr/bin/python2.7
# -*- coding:utf-8 -*-

"""
@author:    tz_zs
"""

import numpy as np
import matplotlib.pyplot as plt


x1 = np.linspace(0.0, 5.0)
x2 = np.linspace(0.0, 2.0)

y1 = np.cos(2 * np.pi * x1) * np.exp(-x1)
y2 = np.cos(2 * np.pi * x2)

plt.subplot(2, 1, 1)
plt.plot(x1, y1, 'o-')
plt.title('A tale of 2 subplots')
plt.ylabel('Damped oscillation')

plt.subplot(2, 1, 2)
plt.plot(x2, y2, '.-')
plt.xlabel('time (s)')
plt.ylabel('Undamped')

plt.show()
.
·
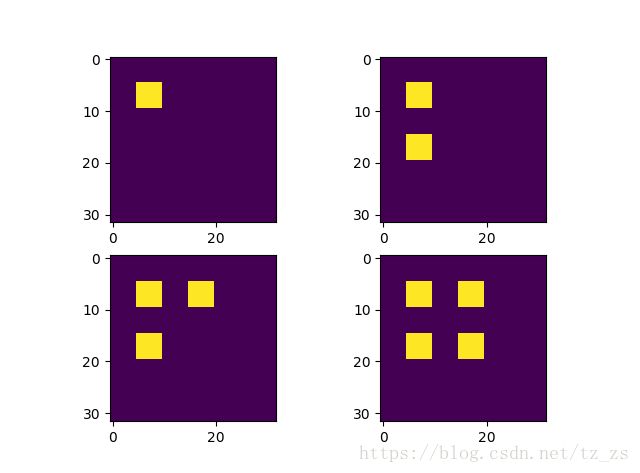
# -*- coding: utf-8 -*-
"""
@author: tz_zs
"""
import numpy as np
import matplotlib.pyplot as plt

square = np.zeros((32, 32))

square[5:10, 5:10] = 1
plt.subplot(221)
plt.imshow(square)

square[15:20, 5:10] = 1
plt.subplot(222)
plt.imshow(square)

square[5:10, 15:20] = 1
plt.subplot(223)
plt.imshow(square)

square[15:20, 15:20] = 1
plt.subplot(224)
plt.imshow(square)
.
.
end


 4230
4230

 被折叠的 条评论
为什么被折叠?
被折叠的 条评论
为什么被折叠?
 到【灌水乐园】发言


