


市场有风险,投资需谨慎,回测结果不代表未来表现。本策略示例旨在学习交流,实盘前务必充分理解并进行严格测试。以下代码均基于天勤量化test编写,仅作参考,不为交易结果负责!!!
反转策略介绍
反转交易策略是一种逆市场趋势而动的交易方法,核心理念是市场价格的波动通常遵循"波动-反弹-波动"的节奏,价格短期内大幅上涨或下跌后,往往会因为获利回吐或超跌反弹而发生方向转变。反转交易策略正是抓住这种价格回归均值的特性,在价格达到极端状态时逆势而为。
该策略通常在以下市场环境中表现更好:
-
区间震荡市场
-
波动率较大的市场
-
没有明显趋势的盘整市场
-
短线交易
策略原理
判断反转点的方法
-
技术指标判断: 运用超买/超卖指标判断市场情绪,如RSI、KDJ或随机指标
-
价格形态识别: 识别价格形成的各类反转形态,如双顶、双底、头肩顶等
-
支撑阻力位: 利用重要价格水平作为潜在反转区域
-
波动突破: 价格突破波动通道(如布林带)后往往会发生反转
策略实现
本文将介绍一个基于RSI和布林带组合指标的黄金期货反转交易系统,该系统旨在捕捉价格在短期内的反弹或回落机会,同时结合均线趋势过滤来提高胜率和盈亏比。
交易标的与参数设定
-
交易品种: 上海期货交易所黄金期货主力合约
-
K线周期: 1小时K线
-
反转指标: RSI+ 布林带
-
过滤器: 20小时和60小时均线趋势判断
策略关键参数
RSI_PERIOD = 9            # RSI周期
OVERBOUGHT = 78           # 超买阈值
OVERSOLD = 22             # 超卖阈值
BOLL_PERIOD = 15          # 布林带周期
BOLL_DEV = 2.5            # 布林带标准差倍数
STOP_LOSS_PCT = 0.015     # 止损比例
TAKE_PROFIT_PCT = 0.045   # 止盈比例
MA_SHORT = 20             # 短期均线周期
MA_LONG = 60              # 长期均线周期
信号生成逻辑
做多信号:
- RSI进入超卖区域(RSI < 22)
- 价格触及或突破布林带下轨
- 处于下降趋势中(MA短期 < MA长期)
做空信号:
- RSI进入超买区域(RSI > 78)
- 价格触及或突破布林带上轨
- 处于上升趋势中(MA短期 > MA长期)
天勤策略代码
#!/usr/bin/env python
# -*- coding: utf-8 -*-
__author__ = "Chaos"
from tqsdk import TqApi, TqAuth, TargetPosTask, TqSim, TqBacktest, BacktestFinished
from tqsdk.ta import RSI, BOLL, MA
from datetime import datetime
from tqsdk.tafunc import time_to_str

# 策略参数
SYMBOL = "SHFE.au2106"  # 交易合约
RSI_PERIOD = 9  # RSI周期
OVERBOUGHT = 78  # 超买阈值
OVERSOLD = 22  # 超卖阈值
BOLL_PERIOD = 15  # 布林带周期
BOLL_DEV = 2.5  # 布林带标准差倍数
STOP_LOSS_PCT = 0.015  # 止损比例
TAKE_PROFIT_PCT = 0.045  # 止盈比例
TRADE_VOL = 10  # 交易手数

account = TqSim()
api = TqApi(web_gui=True,backtest=TqBacktest
        (start_dt=datetime(2020, 11, 1),
        end_dt=datetime(2021, 5, 1)),
        account=account, auth=TqAuth("快期账号", "快期密码"))

# 订阅K线和行情
klines = api.get_kline_serial(SYMBOL, 60 * 60)  # 小时线
quote = api.get_quote(SYMBOL)

# 创建持仓管理任务
target_pos = TargetPosTask(api, SYMBOL)

# 策略主循环
try:
    position = 0  # 当前持仓方向,1为多,-1为空,0为空仓
    entry_price = 0  # 入场价格
    stop_loss = 0  # 止损价格
    take_profit = 0  # 止盈价格

    while True:
        api.wait_update()
        print(time_to_str(klines.datetime.iloc[-2]))

        if api.is_changing(klines.iloc[-1], "datetime"):  # 新K线产生
            # 计算指标
            rsi = RSI(klines, RSI_PERIOD)
            boll = BOLL(klines, BOLL_PERIOD, BOLL_DEV)
            current_rsi = rsi.rsi.iloc[-2]
            current_close = klines.close.iloc[-2]
            up_track = boll["top"].iloc[-2]
            mid_track = boll["mid"].iloc[-2]
            low_track = boll["bottom"].iloc[-2]

            # 加入MA趋势过滤
            ma_short = MA(klines, 20)  # 20小时均线
            ma_long = MA(klines, 60)  # 60小时均线
            trend_up = ma_short.ma.iloc[-2] > ma_long.ma.iloc[-2]
            trend_down = ma_short.ma.iloc[-2] < ma_long.ma.iloc[-2]

            print(
                f"当前价格: {current_close}, RSI: {current_rsi}, 上轨: {up_track}, 中轨: {mid_track}, 下轨: {low_track}")

            # 空仓状态下的交易信号判断
            if position == 0:
                # 超卖信号 - 做多
                if current_rsi < OVERSOLD and current_close < low_track and trend_down:
                    print(f"反转做多信号! RSI: {current_rsi}, 价格: {current_close}, 下轨: {low_track}")
                    target_pos.set_target_volume(TRADE_VOL)
                    position = 1
                    entry_price = current_close
                    stop_loss = entry_price * (1 - STOP_LOSS_PCT)
                    take_profit = entry_price * (1 + TAKE_PROFIT_PCT)
                    print(f"做多开仓! 入场价: {entry_price}, 止损: {stop_loss}, 止盈: {take_profit}")

                # 超买信号 - 做空
                elif current_rsi > OVERBOUGHT and current_close > up_track and trend_up:
                    print(f"反转做空信号! RSI: {current_rsi}, 价格: {current_close}, 上轨: {up_track}")
                    target_pos.set_target_volume(-TRADE_VOL)
                    position = -1
                    entry_price = current_close
                    stop_loss = entry_price * (1 + STOP_LOSS_PCT)
                    take_profit = entry_price * (1 - TAKE_PROFIT_PCT)
                    print(f"做空开仓! 入场价: {entry_price}, 止损: {stop_loss}, 止盈: {take_profit}")

            # 持仓状态下的管理
            else:
                # 多头持仓管理
                if position == 1:
                    # 如果盈利超过2%,将止损提高到入场价附近
                    if current_close >= entry_price * 1.02:
                        stop_loss = entry_price * 1.002  # 移动止损到保本+0.2%

                    # 止盈止损检查
                    if current_close <= stop_loss:
                        print(f"触发止损! 价格: {current_close}, 止损线: {stop_loss}")
                        target_pos.set_target_volume(0)
                        position = 0
                    elif current_close >= take_profit:
                        print(f"触发止盈! 价格: {current_close}, 止盈线: {take_profit}")
                        target_pos.set_target_volume(0)
                        position = 0
                    # 回归平仓
                    elif current_close >= mid_track and current_rsi >= 50 and (current_close - entry_price)/entry_price >= 0.02:
                        print(f"均值回归平仓信号! 价格: {current_close}, 中轨: {mid_track}, RSI: {current_rsi}")
                        target_pos.set_target_volume(0)
                        position = 0

                # 空头持仓管理
                elif position == -1:
                    # 如果盈利超过2%,将止损提高到入场价附近
                    if current_close <= entry_price * 0.98:
                        stop_loss = entry_price * 0.998  # 移动止损到保本-0.2%

                    # 止盈止损检查
                    if current_close >= stop_loss:
                        print(f"触发止损! 价格: {current_close}, 止损线: {stop_loss}")
                        target_pos.set_target_volume(0)
                        position = 0
                    elif current_close <= take_profit:
                        print(f"触发止盈! 价格: {current_close}, 止盈线: {take_profit}")
                        target_pos.set_target_volume(0)
                        position = 0
                    # 回归平仓
                    elif current_close <= mid_track and current_rsi <= 50 and (current_close - entry_price)/entry_price >= 0.02:
                        print(f"均值回归平仓信号! 价格: {current_close}, 中轨: {mid_track}, RSI: {current_rsi}")
                        target_pos.set_target_volume(0)
                        position = 0

except BacktestFinished:
    api.close()
回测结果分析
回测初始设置
-
回测周期: 2020年11月1日至2021年4月30日
-
交易品种: SHFE.au2106(上海期货交易所黄金2106合约)
-
初始资金: 1000万元
回测结果
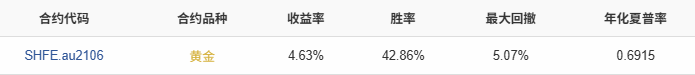
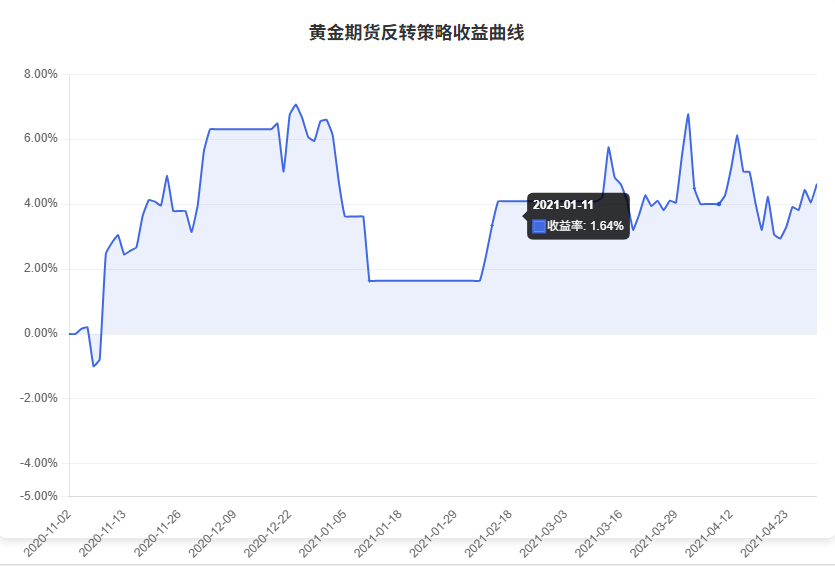
上表回测结果中SHFE.au2106的累计收益走势图


 1305
1305

 被折叠的 条评论
为什么被折叠?
被折叠的 条评论
为什么被折叠?
 到【灌水乐园】发言


