


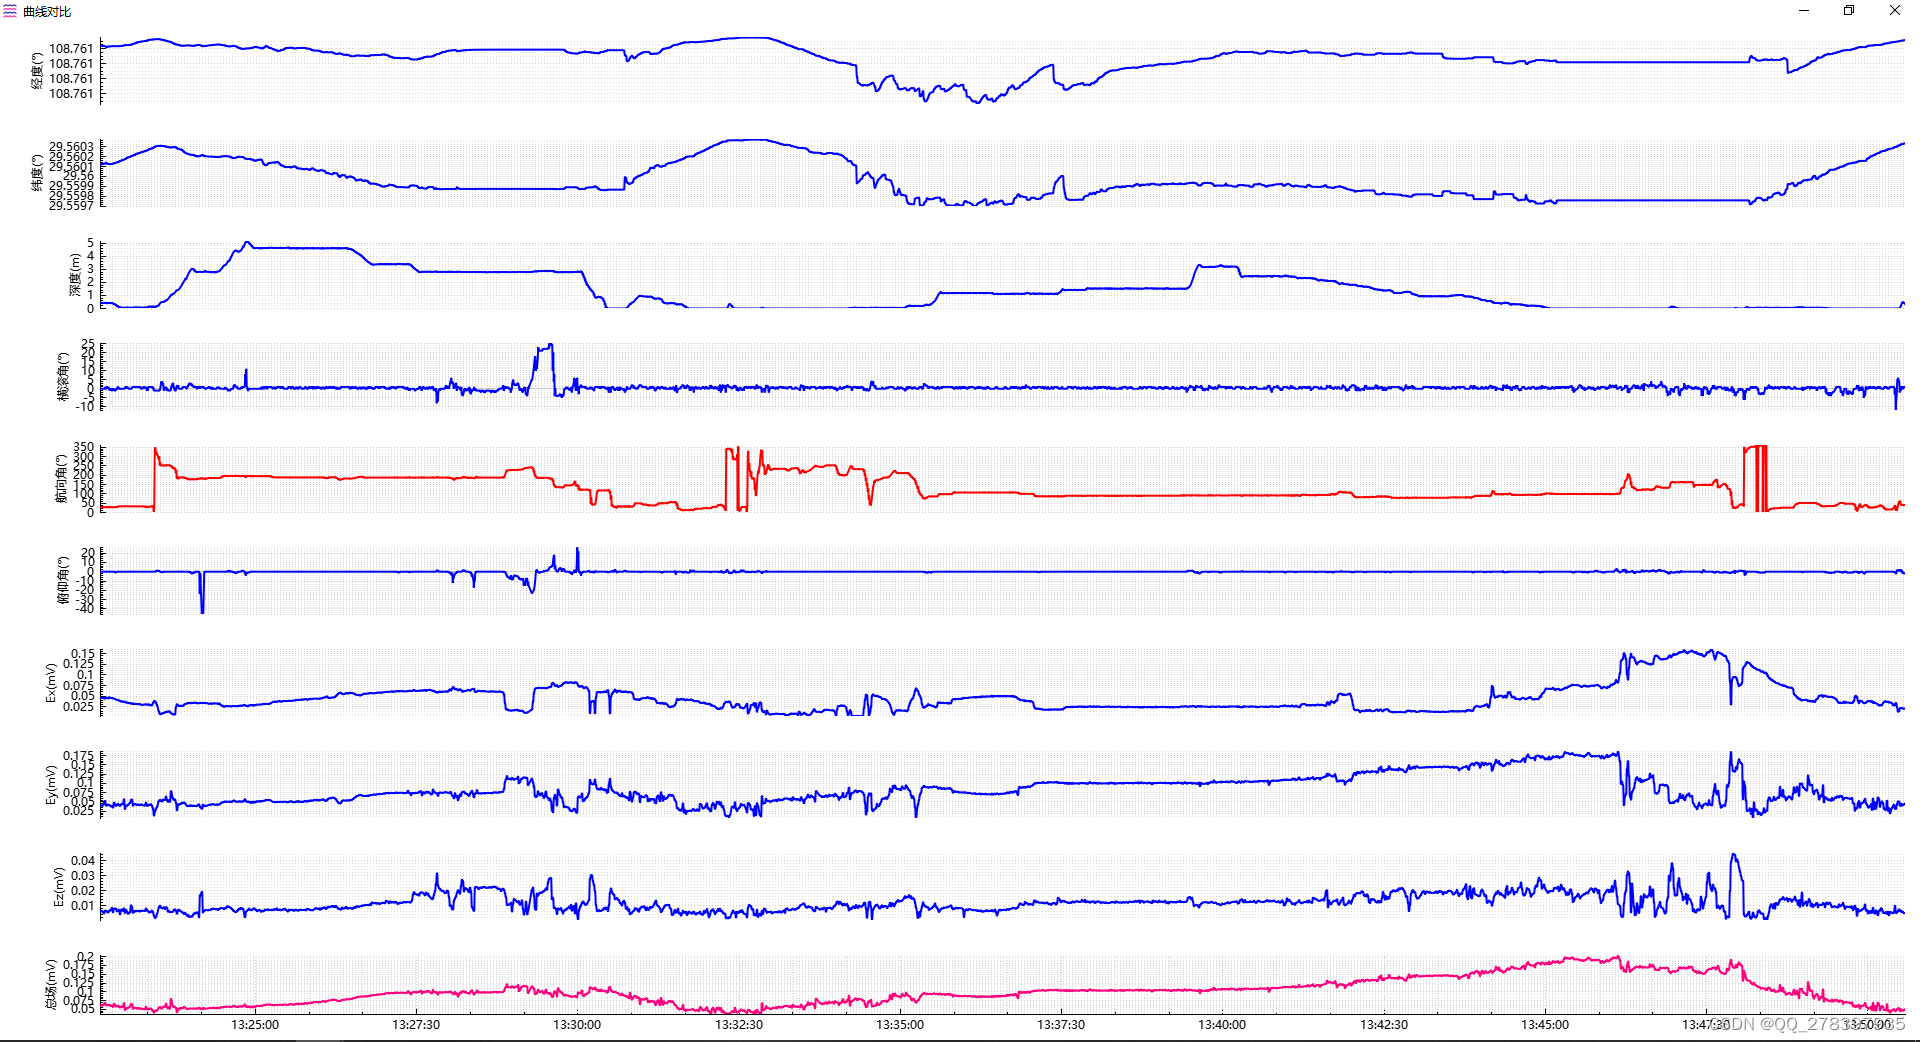
这个参照了一个大佬的代码,时间太久,不记得出处了。
#include "AttitudeWidget.h"
#include "ui_AttitudeWidget.h"

#include "AttitudeWorker.h"

#include <QFileDialog>

#include <QThreadPool>

#include "QCustomPlot/XxwCustomPlot.h"

AttitudeWidget::AttitudeWidget(QSettings* poSet, QWidget* parent) :
    QWidget(parent),
    ui(new Ui::AttitudeWidget), poSet(poSet)
{
    ui->setupUi(this);

    db = QSqlDatabase::addDatabase("QSQLITE", "Main");
    db.setDatabaseName("SIG.db"); //设置数据库名称

    if(!db.isOpen())
    {
        if(!db.open())
        {
            qDebugV0() << "open error:" << db.lastError().text();
            this->recvMsg(db.lastError().text());
            return;
        }
        else
        {
            qDebugV0() << "database connect OK!";
        }
    }
    QSqlQuery query(db);
    query.exec("CREATE TABLE IF NOT EXISTS Attitude(DevId TEXT, "
               "TaskName TEXT, CreateTime TEXT, Timestamp TEXT, "
               "pitch REAL, roll REAL, yaw REAL)");

    this->refresh();

    ui->splitterH->setStretchFactor(0, 2);
    ui->splitterH->setStretchFactor(1, 1);

    ui->splitterV->setStretchFactor(0, 4);
    ui->splitterV->setStretchFactor(1, 1);

    ui->tableView->setSelectionBehavior(QAbstractItemView::SelectRows);
}

AttitudeWidget::~AttitudeWidget()
{
    delete ui;

    db.close();
}

void AttitudeWidget::on_pushButtonImport_clicked()
{
    QString oStrPath = poSet->value("PATH_OPEN").toString();

    if(oStrPath.isEmpty())
    {
        oStrPath = QCoreApplication::applicationDirPath();
    }

    QStringList aoStrFileName = QFileDialog::getOpenFileNames(this, tr("打开姿态文件"),
                                oStrPath,
                                tr("Raw(*_atti*.dat)"));

    foreach(QString oStrFileName, aoStrFileName)
    {

        AttitudeWorker* poWorker = new AttitudeWorker(oStrFileName);
        poWorker->setParent(nullptr);

        connect(poWorker, &AttitudeWorker::sigMsg, this, &AttitudeWidget::recvMsg);

        QThreadPool::globalInstance()->start(poWorker);
    }

    if(!aoStrFileName.isEmpty())
    {
        QFileInfo oFileInfo( aoStrFileName.first() );

        if(! oFileInfo.absolutePath().isEmpty())
        {
            poSet->setValue("PATH_OPEN",  oFileInfo.absolutePath());
        }
    }
}

void AttitudeWidget::on_pushButtonClear_clicked()
{
    QMessageBox::StandardButton standarButton = QMessageBox::question(this,
        "警告",
        "谨慎操作!",
        QMessageBox::Ok | QMessageBox::Cancel,
        QMessageBox::Cancel);
    switch (standarButton)
    {
        case QMessageBox::Ok:
            if(poModel != nullptr)
            {
                poModel->setQuery("delete from Attitude");

                poModel->submit();
            }
            break;
        case QMessageBox::Cancel:

            break;
        default:
            break;
    }
}

void AttitudeWidget::on_pushButtonRefresh_clicked()
{
    this->refresh();
}

void AttitudeWidget::recvMsg(QString oStrMsg)
{
    ui->textBrowser->append(oStrMsg);
}

void AttitudeWidget::refresh()
{
    // 创建模型和映射器
    if(poModel == nullptr)
    {
        poModel = new QSqlQueryModel;
    }
    else
    {
        poModel->clear();
    }

    poModel->setQuery("SELECT * FROM Attitude");
    poModel->setHeaderData(ATTITUDE_TABLE_DEV_ID, Qt::Horizontal, "设备编号");
    poModel->setHeaderData(ATTITUDE_TABLE_TASK_NAME, Qt::Horizontal, "任务名称");
    poModel->setHeaderData(ATTITUDE_TABLE_CREATE_TIME, Qt::Horizontal, "创建时间");
    poModel->setHeaderData(ATTITUDE_TABLE_TIMESTAMP, Qt::Horizontal, "时间戳");
    poModel->setHeaderData(ATTITUDE_TABLE_PITCH, Qt::Horizontal, "俯仰角");
    poModel->setHeaderData(ATTITUDE_TABLE_ROLL, Qt::Horizontal, "横滚角");
    poModel->setHeaderData(ATTITUDE_TABLE_YAW, Qt::Horizontal, "航向角");

    ui->tableView->setModel(poModel);

    ui->tableView->repaint();

    QSqlQuery query(db);

    //设备名称发生变化的时候
    ui->comboBoxDevId->clear();
    query.exec("select DISTINCT DevId from Attitude");
    while(query.next())
    {
        ui->comboBoxDevId->addItem( query.value(0).toString());
    }
    query.clear();
    ui->comboBoxDevId->repaint();

    connect(ui->comboBoxDevId, &QComboBox::currentTextChanged, this, [ = ](QString oStrDevId)
    {
        QSqlQuery query(db);

        ui->comboBoxTaskName->clear();
        query.exec(QString("select DISTINCT TaskName from Attitude where DevId = '%1'").arg(oStrDevId));
        while(query.next())
        {
            ui->comboBoxTaskName->addItem( query.value(0).toString());
        }
        query.clear();
        ui->comboBoxTaskName->repaint();
    });

    //任务名称发生变化的时候
    query.clear();
    ui->comboBoxTaskName->clear();
    query.exec("select DISTINCT TaskName from Attitude");
    while(query.next())
    {
        ui->comboBoxTaskName->addItem( query.value(0).toString());
    }
    query.clear();
    ui->comboBoxCreateTime->repaint();

    connect(ui->comboBoxTaskName, &QComboBox::currentTextChanged, this, [ = ](QString oStrTaskName)
    {
        QSqlQuery query(db);

        ui->comboBoxCreateTime->clear();
        query.exec(QString("select DISTINCT CreateTime from Attitude where DevId = '%1' AND TaskName = '%2' ")
                   .arg(ui->comboBoxDevId->currentText())
                   .arg(oStrTaskName));
        while(query.next())
        {
            ui->comboBoxCreateTime->addItem( query.value(0).toString());
        }
        query.clear();
        ui->comboBoxCreateTime->repaint();
    });

    // Set the resize mode for all columns to ResizeToContents
    for (int col = 0; col < ui->tableView->horizontalHeader()->count(); ++col)
    {
        ui->tableView->horizontalHeader()->setSectionResizeMode(col, QHeaderView::ResizeToContents);
    }

    ui->tableView->repaint();
}


//绘制姿态欧拉角
void AttitudeWidget::drawAttitude(QVector<double> avTimestamp, QVector<QVector<double> > vvdAttitude)
{
    ui->plot->setMinimumSize(QSize(1024, 633));
    ui->plot->setWindowTitle("姿态");
    ui->plot->setWindowIcon(QIcon(":/new/prefix1/image/accelerometer-sensor.png"));
    ui->plot->setWindowModality(Qt::ApplicationModal);

    ui->plot->setInteractions(QCP::iRangeDrag | QCP::iRangeZoom | QCP::iSelectAxes | QCP::iSelectLegend | QCP::iSelectPlottables);
    ui->plot->plotLayout()->clear();   // 首先清空默认的轴矩形,让我们从头开始

    for(int i = 0; i < 3; ++i)
    {
        QCPAxisRect* volumeAxisRect = new QCPAxisRect(ui->plot);
        ui->plot->plotLayout()->addElement(i, 0, volumeAxisRect);

        QCPAxis* poAxisX = volumeAxisRect->axis(QCPAxis::atBottom);
        QCPAxis* poAxisY = volumeAxisRect->axis(QCPAxis::atLeft);

        //Field
        poAxisX->grid()->setSubGridVisible(true);
        poAxisY->grid()->setSubGridVisible(true);

        volumeAxisRect->setAutoMargins(QCP::msRight | QCP::msTop | QCP::msBottom);
        volumeAxisRect->setMargins(QMargins(100, 0, 0, 0));

        poAxisY->setPadding(0); // 这里的5是你想要的额外填充
        poAxisY->setTickLabelPadding(5); // 这里的5是你想要的额外填充
        poAxisY->setLabelPadding(5); // 这里的5是你想要的额外填充

        poAxisX->setVisible((i == 2) ? true : false);

        QSharedPointer<QCPAxisTickerDateTime> dateTicker(new QCPAxisTickerDateTime);//日期做X轴
        dateTicker->setDateTimeFormat("HH:mm:ss.zzz");//日期格式(可参考QDateTime::fromString()函数)
        dateTicker->setTickCount(12);
        poAxisX->setTicker(dateTicker);//设置X轴为时间轴

        QList<QCPAxis*> aaxisField;
        aaxisField << poAxisX;
        volumeAxisRect->setRangeZoomAxes(aaxisField);

        poAxisY->setVisible(true);
        poAxisY->setLabel(CONST_ATTITUDE.at(i));

        auto poGraph = ui->plot->addGraph(poAxisX, poAxisY);
        poGraph->setScatterStyle(QCPScatterStyle(QCPScatterStyle::ssDisc, 5));
        poGraph->setName(CONST_ATTITUDE.at(i));
        poGraph->setData(avTimestamp, vvdAttitude.at(i));
        poGraph->setLineStyle(QCPGraph::lsLine);
        //poGraphEx->setScatterStyle(QCPScatterStyle(QCPScatterStyle::ssDisc, 8));
        poGraph->setPen(QPen(Qt::blue, 2));

        poGraph->rescaleKeyAxis(true);
        poGraph->rescaleValueAxis(true, true);
        poGraph->rescaleAxes();

        auto poThread = new QThread;
        poGraph->setParent(nullptr);
        poGraph->moveToThread(poThread);
        poGraph->setVisible(true);
    }

    for(int i = 0; i < 3; ++i)
    {
        QCPAxisRect* poRecti = (QCPAxisRect*)ui->plot->plotLayout()->element(i, 0);
        for(int j = 0; j < 3; ++j)
        {

            if(i != j)
            {
                QCPAxisRect* poRectj = (QCPAxisRect*)ui->plot->plotLayout()->element(j, 0);

                connect(poRecti->axis(QCPAxis::atBottom), QOverload<const QCPRange&>::of(&QCPAxis::rangeChanged),
                        poRectj->axis(QCPAxis::atBottom), QOverload<const QCPRange&>::of(&QCPAxis::setRange));
            }
        }
    }

    ui->plot->replot();
}

//查询
void AttitudeWidget::on_pushButtonSearch_clicked()
{
    QSqlQuery query(db);

    poModel->setQuery(QString("SELECT * FROM ATTITUDE WHERE DevId = '%1' AND TaskName = '%2' AND CreateTime = '%3'" )
                      .arg(ui->comboBoxDevId->currentText())
                      .arg(ui->comboBoxTaskName->currentText())
                      .arg(ui->comboBoxCreateTime->currentText()));

    ui->tableView->setModel(poModel);

    ui->tableView->repaint();

    query.exec(QString("SELECT timestamp, pitch, roll, yaw FROM ATTITUDE WHERE DevId = '%1' AND TaskName = '%2' AND CreateTime = '%3'" )
               .arg(ui->comboBoxDevId->currentText())
               .arg(ui->comboBoxTaskName->currentText())
               .arg(ui->comboBoxCreateTime->currentText()));

    QVector<double> avTimestamp;
    QVector<QVector<double> > vvdAttitude;
    QVector<double> avPitch;
    QVector<double> avRoll;
    QVector<double> avYaw;

    while(query.next())
    {
        double dSec = QDateTime::fromString(query.value(0).toString(), "yyyy年MM月dd日 HH:mm:ss.zzz").toMSecsSinceEpoch() / 1000.0;

        this->recvMsg(QString("timestamp: %1\tpitch: %2\troll: %3\tyaw: %4")
                      .arg(query.value(0).toString())
                      .arg(query.value(1).toDouble())
                      .arg(query.value(2).toDouble())
                      .arg(query.value(3).toDouble()));

        avTimestamp.append(dSec);
        avPitch.append(query.value(1).toDouble());
        avRoll.append(query.value(2).toDouble());
        avYaw.append(query.value(3).toDouble());
    }
    vvdAttitude.append(avPitch);
    vvdAttitude.append(avRoll);
    vvdAttitude.append(avYaw);

    this->drawAttitude(avTimestamp, vvdAttitude);

    query.clear();
}

void AttitudeWidget::on_pushButtonClearLog_clicked()
{
    ui->textBrowser->clear();
}
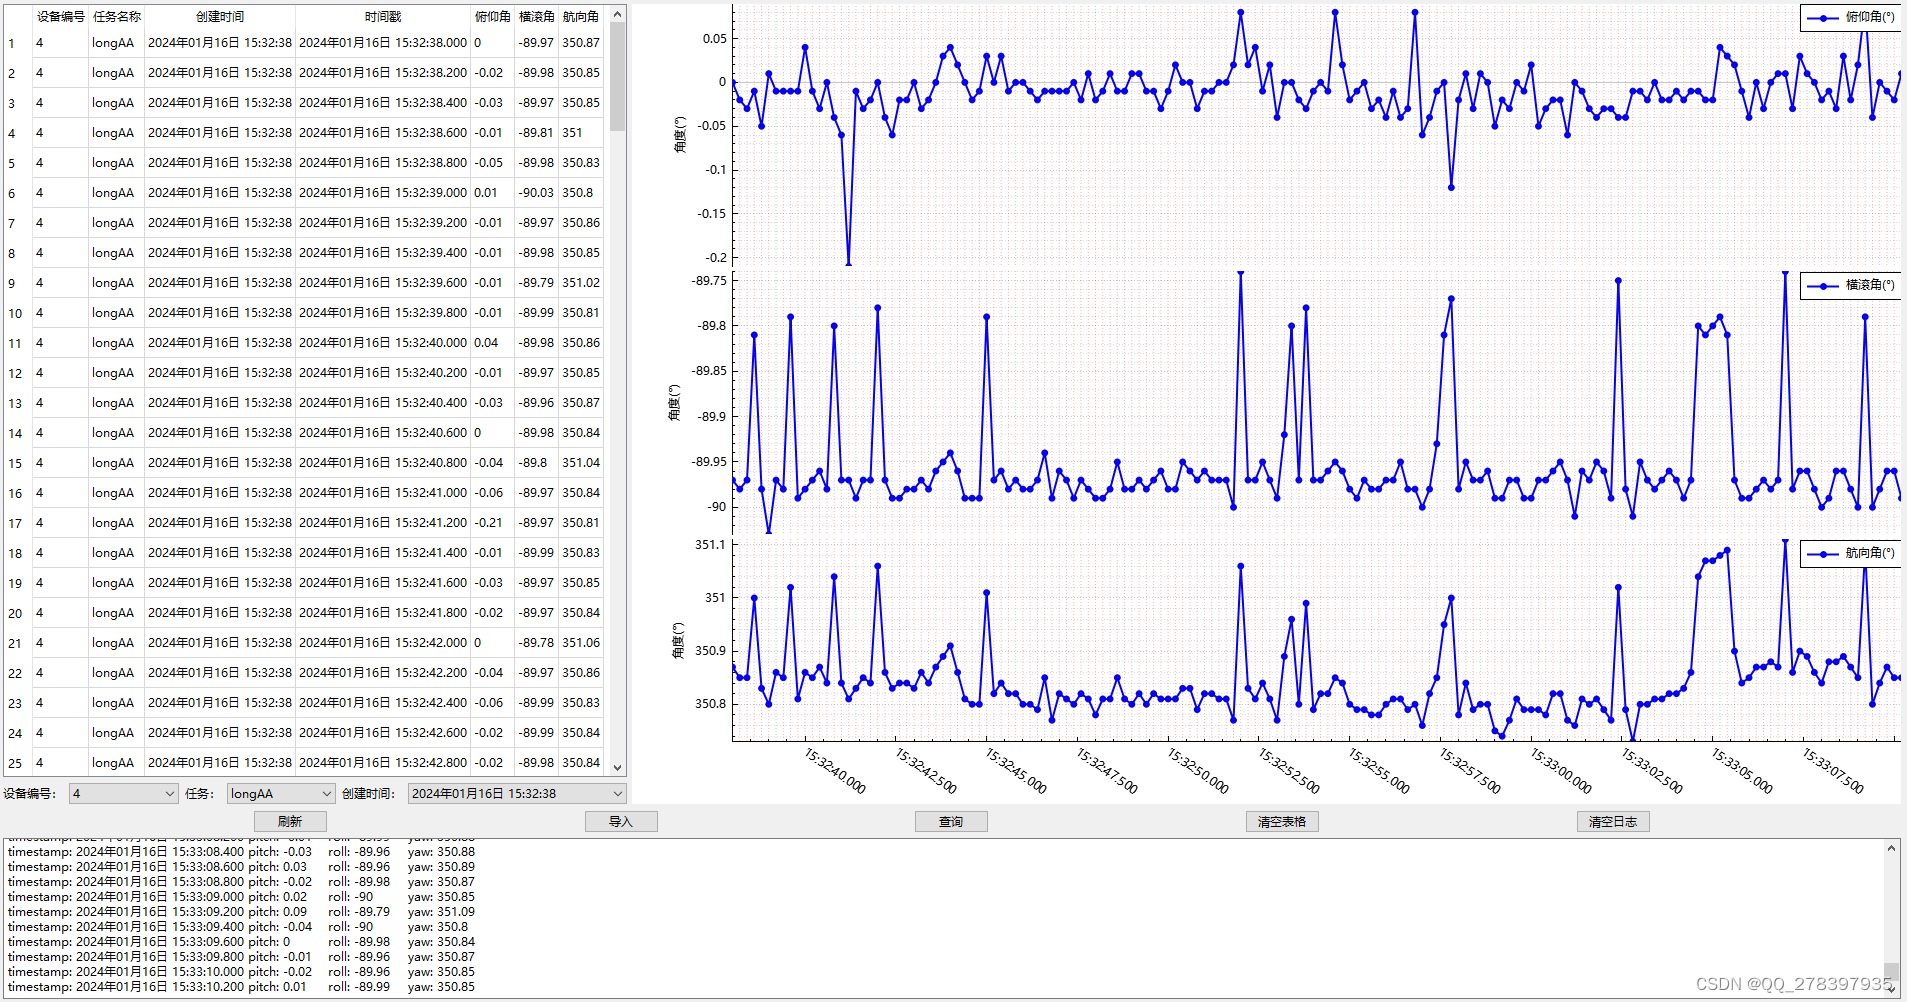
另外一个地方也用到了,代码差不多。算是个记录。
#include "MultiAxisWidget.h"
#include "ui_MultiAxisWidget.h"

#include "QCustomPlot/XxwCustomPlot.h"

MultiAxisWidget::MultiAxisWidget(int iCnt, QWidget *parent) :
    QWidget(parent), ui(new Ui::MultiAxisWidget), iCnt(iCnt)
{
    ui->setupUi(this);

    ui->plot->setWindowTitle("曲线对比");
    ui->plot->setWindowIcon(QIcon(":/new/prefix1/image/multiple.png"));
    ui->plot->setMinimumSize(QSize(1000, 618));
    ui->plot->setInteractions(QCP::iRangeDrag | QCP::iRangeZoom | QCP::iSelectAxes | QCP::iSelectLegend | QCP::iSelectPlottables);

    ui->plot->plotLayout()->clear();   // 首先清空默认的轴矩形,让我们从头开始,这一行语句之后,就不要有任何 plot操作了!都清除了。

    QGridLayout *poGrid = new QGridLayout;

    poStatusBar = new QStatusBar;
    poStatusBar->showMessage("单击曲线,显示对应时域文件标签。");

    QVBoxLayout *poHLayout = new QVBoxLayout;

    poHLayout->insertWidget(0, ui->plot, 1);
    poHLayout->insertWidget(1, poStatusBar, 0);

    poGrid->addLayout(poHLayout, 0, 0, Qt::AlignCenter);

    this->setLayout(poGrid);

    iCntIndex = 0;
}

MultiAxisWidget::~MultiAxisWidget()
{
    delete ui;
}

void MultiAxisWidget::recvRawData(int iRow, QString oStrLabel, QVector<double> adX, QVector<double> adY)
{
    QCPAxisRect *volumeAxisRect = new QCPAxisRect(ui->plot);
    ui->plot->plotLayout()->addElement(iCntIndex, 0, volumeAxisRect);

    QCPAxis *poAxisX = volumeAxisRect->axis(QCPAxis::atBottom);
    QCPAxis *poAxisY = volumeAxisRect->axis(QCPAxis::atLeft);

    poAxisY->grid()->setZeroLinePen(QPen(Qt::red));

    //Field
    poAxisX->grid()->setSubGridVisible(true);
    poAxisY->grid()->setSubGridVisible(true);

    volumeAxisRect->setAutoMargins(QCP::msRight | QCP::msTop | QCP::msBottom);
    volumeAxisRect->setMargins(QMargins(100, 0, 0, 0));

    poAxisY->setPadding(0); // 这里的5是你想要的额外填充
    poAxisY->setTickLabelPadding(5); // 这里的5是你想要的额外填充
    poAxisY->setLabelPadding(5); // 这里的5是你想要的额外填充

    poAxisX->setVisible(false);

    // QSharedPointer<QCPAxisTickerDateTime> dateTicker(new QCPAxisTickerDateTime);//日期做X轴
    // dateTicker->setDateTimeFormat("HH:mm:ss");//日期格式(可参考QDateTime::fromString()函数)
    // dateTicker->setTickCount(12);
    // poAxisX->setTicker(dateTicker);//设置X轴为时间轴

    QList<QCPAxis *> aaxisField;
    aaxisField << poAxisX;
    volumeAxisRect->setRangeZoomAxes(aaxisField);

    poAxisY->setVisible(true);
    poAxisY->setLabel(oStrLabel);

    auto poGraph = ui->plot->addGraph(poAxisX, poAxisY);

    poGraph->setName(oStrLabel);
    poGraph->setData(adX, adY);
    poGraph->setLineStyle(QCPGraph::lsLine);
    //poGraphEx->setScatterStyle(QCPScatterStyle(QCPScatterStyle::ssDisc, 8));
    poGraph->setPen(QPen(Qt::blue, 2));

    poGraph->rescaleKeyAxis(true);
    poGraph->rescaleValueAxis(true, true);
    poGraph->rescaleAxes();

    auto poThread = new QThread;
    poGraph->setParent(nullptr);
    poGraph->moveToThread(poThread);
    poGraph->setVisible(true);

    ++iCntIndex;

    if(iCntIndex == iCnt)
    {
        QTimer::singleShot(1000, this, [ = ]()
        {
            this->linkage();
        });
    }

    ui->plot->replot();
}

//多  x轴联动
void MultiAxisWidget::linkage()
{
    for(int i = 0; i < iCnt; ++i)
    {
        QCPAxisRect *poRecti = (QCPAxisRect *)ui->plot->plotLayout()->element(i, 0);
        for(int j = 0; j < iCnt; ++j)
        {
            if(i != j)
            {
                QCPAxisRect *poRectj = (QCPAxisRect *)ui->plot->plotLayout()->element(j, 0);

                connect(poRecti->axis(QCPAxis::atBottom), QOverload<const QCPRange &>::of(&QCPAxis::rangeChanged),
                        poRectj->axis(QCPAxis::atBottom), QOverload<const QCPRange &>::of(&QCPAxis::setRange));
            }
        }
    }

    //鼠标单击曲线,在statusBar上展示文件名
    connect(ui->plot, &QCustomPlot::plottableClick, this, [ = ](QCPAbstractPlottable * plottable, int dataIndex, QMouseEvent * event)
    {
        poStatusBar->showMessage(plottable->name());
    });

    //鼠标双击曲线,在颜色对话框中给被点击的曲线设置颜色
    connect(ui->plot, &QCustomPlot::plottableDoubleClick, this, [ = ](QCPAbstractPlottable * plottable, int dataIndex, QMouseEvent * event)
    {
        QColorDialog colorDialog;
        colorDialog.setCurrentColor(Qt::red);

        // 显示对话框
        int result = colorDialog.exec();

        // 检查用户是否选择了颜色
        if (result == QDialog::Accepted)
        {
            // 获取选择的颜色
            QColor selectedColor = colorDialog.selectedColor();

            plottable->setPen(QPen(selectedColor, 2));

            ui->plot->replot();
        }
    });

    ui->plot->replot();
}
 1万+


 扫一扫


 被折叠的 条评论
为什么被折叠?
 到【灌水乐园】发言


