


 本文主要分享Python环境搭建过程中的经验。作者使用Python 3.6和Windows 7系统,提及两个常见报错,一是Matplotlib使用非GUI后端无法显示图形,二是文件路径不存在问题,指出Windows路径需用双反斜杠,还给出数据集地址。
写在最前面:
原理先不谈,先搭起环境跑一下
等我弄清楚在写。。。
python3.6
windows 7
import matplotlib
matplotlib.use('TkAgg')
import matplotlib.pyplot as plt
import pandas as pd
import numpy as np
from sklearn.model_selection import TimeSeriesSplit # you have everything done for you
from sklearn.linear_model import LinearRegression
from sklearn.model_selection import cross_val_score
from sklearn.preprocessing import StandardScaler
from sklearn.linear_model import LassoCV, RidgeCV
# for time-series cross-validation set 5 folds
tscv = TimeSeriesSplit(n_splits=5)
def mean_absolute_percentage_error(y_true, y_pred):
return np.mean(np.abs((y_true - y_pred) / y_true)) * 100
def timeseries_train_test_split(X, y, test_size):
"""
Perform train-test split with respect to time series structure
"""
# get the index after which test set starts
test_index = int(len(X) * (1 - test_size))
X_train = X.iloc[:test_index]
y_train = y.iloc[:test_index]
X_test = X.iloc[test_index:]
y_test = y.iloc[test_index:]
return X_train, X_test, y_train, y_test
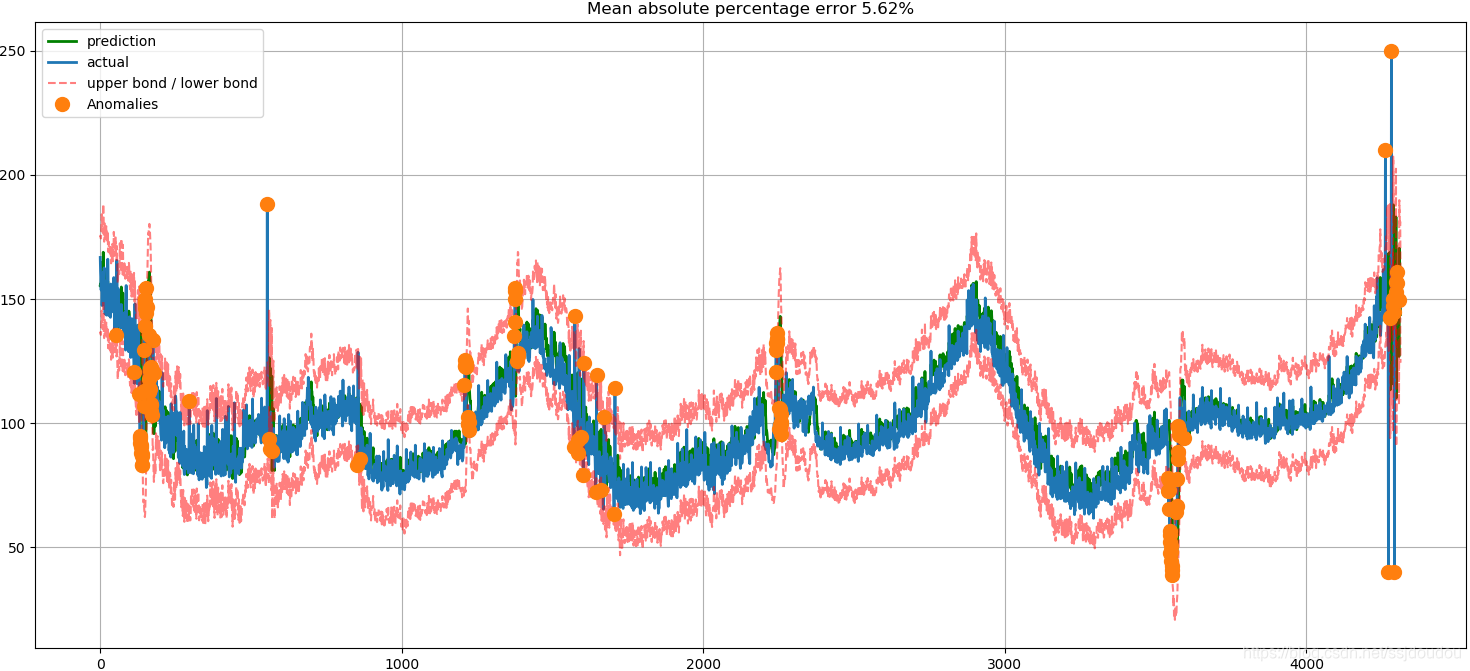
def plotModelResults(model, X_train, X_test, y_train, y_test, plot_intervals=False, plot_anomalies=False):
"""
Plots modelled vs fact values, prediction intervals and anomalies
"""
prediction = model.predict(X_test)
plt.figure(figsize=(15, 7))
plt.plot(prediction, "g", label="prediction", linewidth=2.0)
plt.plot(y_test.values, label="actual", linewidth=2.0)
if plot_intervals:
cv = cross_val_score(model, X_train, y_train,
cv=tscv,
scoring="neg_mean_absolute_error")
mae = cv.mean() * (-1)
deviation = cv.std()
scale = 20
lower = prediction - (mae + scale * deviation)
upper = prediction + (mae + scale * deviation)
plt.plot(lower, "r--", label="upper bond / lower bond", alpha=0.5)
plt.plot(upper, "r--", alpha=0.5)
if plot_anomalies:
anomalies = np.array([np.NaN] * len(y_test))
anomalies[y_test < lower] = y_test[y_test < lower]
anomalies[y_test > upper] = y_test[y_test > upper]
plt.plot(anomalies, "o", markersize=10, label="Anomalies")
error = mean_absolute_percentage_error(prediction, y_test)
plt.title("Mean absolute percentage error {0:.2f}%".format(error))
plt.legend(loc="best")
plt.tight_layout()
plt.grid(True)
plt.savefig("linear.png")
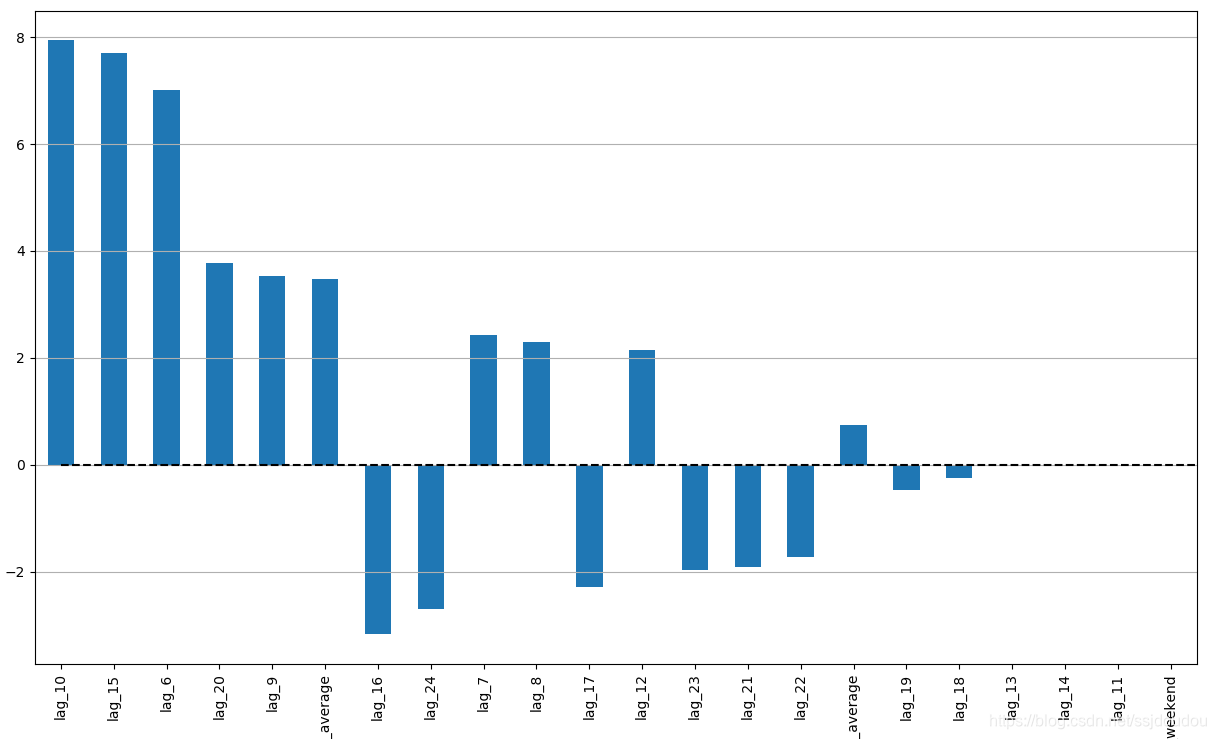
def plotCoefficients(model, X_train):
"""
Plots sorted coefficient values of the model
"""
coefs = pd.DataFrame(model.coef_, X_train.columns)
coefs.columns = ["coef"]
coefs["abs"] = coefs.coef.apply(np.abs)
coefs = coefs.sort_values(by="abs", ascending=False).drop(["abs"], axis=1)
plt.figure(figsize=(15, 9))
coefs.coef.plot(kind='bar')
plt.grid(True, axis='y')
plt.hlines(y=0, xmin=0, xmax=len(coefs), linestyles='dashed')
plt.savefig("linear-cov.png")
def code_mean(data, cat_feature, real_feature):
"""
Returns a dictionary where keys are unique categories of the cat_feature,
and values are means over real_feature
"""
return dict(data.groupby(cat_feature)[real_feature].mean())
def prepareData(series, lag_start, lag_end, test_size, target_encoding=False):
"""
series: pd.DataFrame
dataframe with timeseries
lag_start: int
initial step back in time to slice target variable
example - lag_start = 1 means that the model
will see yesterday's values to predict today
lag_end: int
final step back in time to slice target variable
example - lag_end = 4 means that the model
will see up to 4 days back in time to predict today
test_size: float
size of the test dataset after train/test split as percentage of dataset
target_encoding: boolean
if True - add target averages to the dataset
"""
# copy of the initial dataset
data = pd.DataFrame(series.copy())
data.columns = ["y"]
# lags of series
for i in range(lag_start, lag_end):
data["lag_{}".format(i)] = data.y.shift(i)
# datetime features
# data.index = data.index.to_datetime()
data["hour"] = data.index.hour
data["weekday"] = data.index.weekday
data['is_weekend'] = data.weekday.isin([5, 6]) * 1
if target_encoding:
# calculate averages on train set only
test_index = int(len(data.dropna()) * (1 - test_size))
data['weekday_average'] = list(map(
code_mean(data[:test_index], 'weekday', "y").get, data.weekday))
data["hour_average"] = list(map(
code_mean(data[:test_index], 'hour', "y").get, data.hour))
# frop encoded variables
data.drop(["hour", "weekday"], axis=1, inplace=True)
# train-test split
y = data.dropna().y
X = data.dropna().drop(['y'], axis=1)
X_train, X_test, y_train, y_test = \
timeseries_train_test_split(X, y, test_size=test_size)
return X_train, X_test, y_train, y_test
def plt_linear():
data = pd.read_csv('F:\\vs_for_python\\Jia\\Test\\raw_data.csv',
usecols=['timestamp', 'count'])
data['timestamp'] = pd.to_datetime(data['timestamp'])
data.set_index("timestamp", drop=True, inplace=True)
data.rename(columns={'count': 'y'}, inplace=True)
X_train, X_test, y_train, y_test = \
prepareData(data, lag_start=6, lag_end=25, test_size=0.3, target_encoding=True)
scaler = StandardScaler()
X_train_scaled = scaler.fit_transform(X_train)
X_test_scaled = scaler.transform(X_test)
# lr = LinearRegression()
lr = LassoCV(cv=tscv)
# lr = RidgeCV(cv=tscv)
# lr.fit(X_train_scaled, y_train)
"""
from xgboost import XGBRegressor
lr = XGBRegressor()
# lr = xgb.XGBRegressor(max_depth=5, learning_rate=0.1, n_estimators=160, silent=False, objective='reg:gamma')
"""
lr.fit(X_train_scaled, y_train)
"""
IMPORTANT
Generally tree-based models poorly handle trends in data, compared to linear models,
so you have to detrend your series first or use some tricks to make the magic happen.
Ideally make the series stationary and then use XGBoost, for example, you can forecast
trend separately with a linear model and then add predictions from xgboost to get final forecast.
"""
plotModelResults(lr, X_train=X_train_scaled, X_test=X_test_scaled, y_train=y_train, y_test=y_test, plot_intervals=True, plot_anomalies=True)
plotCoefficients(lr, X_train=X_train)
plt_linear()
plt.show()这里注意两个点,是我自己踩的坑
1、报错Matplotlib is currently using agg, which is a non-GUI backend, so cannot show the figure
import matplotlib
matplotlib.use('TkAgg')  #这里来是Agg,会报错,改为TkAgg即可
2、报错FileNotFoundError: File b'E:\titanicdata\train.csv' does not exist
这里路径一律加\\。
原因如下:反斜杠\是转义字符,想表达\请用\\
P.S. Windows的路径中用反斜杠\,是因为DOS 有一个传统是用斜杠(“/”)表示命令行参数,既然斜杠已经被DOS的命令行占领了,只好找一个最接的,那就是反斜杠\。而Linux等目录路径用斜杠/。
数据集地址:https://github.com/nicolasmiller/pyculiarity/blob/master/tests/raw_data.csv
效果如下:


 3700
3700

 被折叠的 条评论
为什么被折叠?
被折叠的 条评论
为什么被折叠?
 到【灌水乐园】发言


