


参考
序言 · Prometheus 中文文档 (icloudnative.io)
PromQL中Counter相关函数rate(), irate()与 increase() 的使用与区别 - 简书 (jianshu.com)
搭建环境
环境说明
vmware安装ubuntu虚拟机作为开发环境, 虚拟机地址 192.168.71.132
用docker来运行Prometheus和Grafana
在用户目录下创建一个 my_docker目录,/home/sww/sww_project/my_docker
准备docker-compose配置文件
创建一个docker-compose.yml文件
version: '3.3'
services:
  prometheus:
    image: prom/prometheus:v2.25.0
    container_name: prometheus
    volumes:
      - ./prometheus.yml:/etc/prometheus/prometheus.yml
      - prometheus_data:/prometheus
    command:
      - '--config.file=/etc/prometheus/prometheus.yml'
      - '--storage.tsdb.path=/prometheus'
      - '--web.console.libraries=/usr/share/prometheus/console_libraries'
      - '--web.console.templates=/usr/share/prometheus/consoles'
    ports:
      - "9090:9090"
    networks:
      - mynetwork
    extra_hosts:
      - "host.docker.internal:host-gateway"
    restart: unless-stopped

  grafana:
    image:  grafana/grafana:7.3.7
    container_name: grafana
    volumes:
      - grafana_data:/var/lib/grafana
    environment:
      - GF_SECURITY_ADMIN_USER=admin
      - GF_SECURITY_ADMIN_PASSWORD=admin
      - GF_INSTALL_PLUGINS=grafana-piechart-panel
    ports:
      - "3000:3000"
    networks:
      - mynetwork
    extra_hosts:
      - "host.docker.internal:host-gateway"
    restart: unless-stopped

networks:
  mynetwork:
    driver: bridge

volumes:
  prometheus_data:
  grafana_data:
这里配置中用到了如下
    extra_hosts:
      - "host.docker.internal:host-gateway"
这是告诉容器,容器对域名host.docker.internal方访问都转发到host-gateway去。
也就是容器内部访问这个域名 host.docker.internal 时,就会访问到对应的主机上的 host-gateway 地址。
从而达到容器访问主机上服务的效果。
准备prometheus.yml文件
global:
  scrape_interval:     15s # 抓取间隔,默认是1分钟,这里改为15秒作为示例
  evaluation_interval: 15s # 评估规则间隔

alerting:
  alertmanagers:
    - static_configs:
        - targets:
rule_files:
# - "first_rules.yml"
# - "second_rules.yml"

scrape_configs:
  - job_name: 'prometheus'
    static_configs:
      - targets: ['localhost:9090'] # Prometheus自身也需要被监控

  - job_name: 'coffee_app'
    static_configs:
      - targets: ['host.docker.internal:8218'] # 假设Node Exporter的容器名为node_exporter

# 如果有其他服务或exporter需要监控,可以继续添加scrape_config
# 例如,如果你想监控一个名为my_app的服务,可以在这里添加一个新的scrape_config
#  - job_name: 'my_app'
#    static_configs:
#    - targets: ['my_app:8080'] # 假设my_app服务暴露了8080端口用于metrics
我们如果在ubuntu虚拟机中启动一个web服务,比如暴露8218端口,它暴露路由 /metrics提供数据。我们就要配置Prometheus从这个地址获取数据。
这里我们配置的是 host.docker.internal:8218
因为前面容器的docker-compose中我们已经配置了网络,访问host.docker.internal就是访问主机。
运行如下命令,启动grafane和Prometheus。
docker-compose -f "my_docker/docker-compose.yml" up -d --build
验证host.docker.internal可用
在创建好的docker-compose.yml中,再加入一个叫curl的服务。
  curl:
    image: curlimages/curl
    command: curl http://host.docker.internal:8218/metrics
    extra_hosts:
      - "host.docker.internal:host-gateway"
在命令行运行如下,即只启动curl服务
docker-compose -f "docker-compose.yml" up --build curl如果看到用metrics接口的结果,说明地址 http://host.docker.internal:8218/metrics在容器内部可用访问到。
配置grafane数据源
访问192.168.71.132:3000, 即ubuntu中docker容器的grafana服务。
要配置grafana读取Prometheus的监控数据,
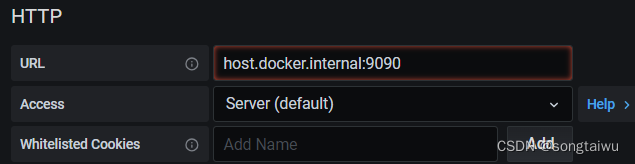
我们可用配置如下几个情况都行
1、host.docker.internal:9090, 容器配置extra_hosts,通过它能访问ubuntu主机的服务。
2、prometheus:9090, 他们的网络配置一样,容器之间直接用名字访问。
3、http://192.168.71.132:9090, 直接用ip访问ubuntu主机的9090端口。
概念 - 指标类型
Prometheus 的客户端库中提供了四种核心的指标类型。但这些类型只是在客户端库 (客户端可以根据不同的数据类型调用不同的API接口) 和在线协议中,实际在Prometheus server中并不对指标类型进行区分,而是简单地把这些指标统一视为无类型的时间序列。
Counter(计数器)
Counter 类型代表一种样本数据单调递增的指标,即只增不减,除非监控系统发生了重置。例如,你可以使用counter 类型的指标来表示服务的请求次数、已完成的任务数、错误发生的次数等。counter 主要有两个方法:
// 将counter值加1
Inc()
// 将指定值加到counter值上,如果指定值<0 会panic
Add(float64)
Counter 类型数据可以让用户方便的了解事件产生的速率的变化,在PromQL 内置的相关操作函数可以提供响应的分析,比如以HTTP应用请求量来进行说明:
// 通过rate()函数获取HTTP请求量的增长率
rate(http_request_total[5m])
// 查询当前系统中,访问量前10的HTTP地址
topk(10, http_request_total)
不要将counter 类型应用于样本数据非单调递增的指标,例如:当前运行的进程数量(应该用Gauge 类型)
Guage(仪表盘)
Guage 类型代表一种样本数据可以任意变化的指标,即可增可减。 guage 通常用于像温度或者内存使用率这种指标数据,也可以表示能随时增加或减少的“总数”, 例如:当前并发请求的数量。
对于Gauge类型的监控指标,通过 PromQL 内置函数 delta() 可以获取样本在一定时间内的变化情况,例如,计算CPU温度在两小时内的差异:
dalta(cpu_temp_celsius{host="zeus"}[2h])
你还可以通过PromQL内置函数 predict_linear() 基于简单线性回归的方式,对样本数据的变化趋势做出预测。例如,基于 2小时的样本数据,来预测主机可用磁盘空间在 4小时之后的剩余情况:
predict_linear(node_filesystem_free{job="node"}[2h], 4 * 3600) < 0
Histogram(直方图)
在大多数情况下人们都倾向于使用某些量化指标的平均值,例如CPU的平均使用率、页面的平均响应时间。这种方式的问题很明显,以系统 API 调用的平均时间为例:如果大多数API请求都维持在 100ms 的响应时间范围内,而个别请求的响应时间需要5s,那么就会导致某些WEB页面的响应时间落在中位数的情况,而这种现象被称为长尾问题。
为了区分是平均的慢还是长尾的慢,最简单的方式就是按照请求延迟的范围进行分组。例如,统计延迟在0~10ms之间的请求数有多少而 10~20ms之间的请求数又有多少。通过这种方式可以快速分析系统慢的原因。 Histogram 和 Summary 都是为了能够解决这样的问题而存在,通过 Histogram 和 Summary 类型的监控指标,我们可以快速了解监控样本的分布情况。
Histogram 在一段时间范围内对数据进行采样(通常是请求持续时间或响应大小等),并将其计入可配置的存储桶(bucket)中,后续可通过指定区间筛选样本,也可统计样本总数,最后一般将数据展示为直方图。
Histogram 类型的样本会提供三种指标(假设指标名称为 <basename> ):
- 样本的值分布在bucket中的数量,命令为 <basename>_bucket{le="<上边界>"}。 解释的更通俗易懂一点,这个值表示指标值小于等于上边界的所有样本数量。
- 所有样本值的大小总和,命名为<basename>_sum。
- 样本总数,命名为<basename>_count。值和 <basename>_bucket{le="+Inf"} 相同。
注意:
bucket 可以理解为对数据指标值域的一个划分,划分的依据应该基于数据值的分布。注意后面的采样点是包含前面的采样点的,假设 xxx_bucket{..., le="0.01"} 的值为 10, 而xxx_bucket{..., le="0.05"} 的值为 30,那么意味着这30个采样点中,有10个是小于10ms的,其余20个采样点的响应时间是介于10ms 和 50ms 之间的。
可以通过 histogram_quantile() 函数来计算 Histogram 类型样本的分位数。假设样本的9分位数(quantile=0.9)的值为x,即表示小于x的采样值的数量占总体采样值的 90%。 Histogram 还可以用来计算应用性能指标值。
实践:
Prometheus四个数据类型中,Histogram类型就是一种直方图数据。histogram类型被用于记录样本数据的分布情况,特别是在跟踪请求延迟、响应时间等场景时非常有用。histogram通过预定义的“桶(buckets)来捕获数据的分布”。
使用的时候,要定义一个Buckets数组,它标识所有样本数据落在的各个区间。每个样本数据都会把它归到一个bucket中并记录其总样本值(比如一个http请求的耗时) 和 样本数(一次请求)。
	// 定义请求延迟直方图
	httpRequestDuration = promauto.NewHistogramVec(
		prometheus.HistogramOpts{
			Name:    "xxx_http_duration",
			Help:    "Histogram of latencies for HTTP requests.",
			Buckets: []float64{.005, .01, .025, .05, .1, .25, .5, 1, 2.5, 5},
		},
		[]string{"path", "ip"},
	)
比如上面代码,我们定义了 5ms、10ms、25ms、50ms、100ms、250ms、500ms、1s、2.5s、5s这些区间。
我们调用微服务接口(应用作为一个go exporter),得到暴露出来的统计数据,用以被Prometheus服务拉取。内容如下:
# HELP xxx_http_duration Histogram of latencies for HTTP requests.
# TYPE xxx_http_duration histogram
xxx_http_duration_bucket{ip="172.17.233.158",path="/product/list",le="0.005"} 0
xxx_http_duration_bucket{ip="172.17.233.158",path="/product/list",le="0.01"} 0
xxx_http_duration_bucket{ip="172.17.233.158",path="/product/list",le="0.025"} 0
xxx_http_duration_bucket{ip="172.17.233.158",path="/product/list",le="0.05"} 1
xxx_http_duration_bucket{ip="172.17.233.158",path="/product/list",le="0.1"} 1
xxx_http_duration_bucket{ip="172.17.233.158",path="/product/list",le="0.25"} 1
xxx_http_duration_bucket{ip="172.17.233.158",path="/product/list",le="0.5"} 1
xxx_http_duration_bucket{ip="172.17.233.158",path="/product/list",le="1"} 1
xxx_http_duration_bucket{ip="172.17.233.158",path="/product/list",le="2.5"} 1
xxx_http_duration_bucket{ip="172.17.233.158",path="/product/list",le="5"} 1
xxx_http_duration_bucket{ip="172.17.233.158",path="/product/list",le="+Inf"} 1
xxx_http_duration_sum{ip="172.17.233.158",path="/product/list"} 0.04435883
xxx_http_duration_count{ip="172.17.233.158",path="/product/list"} 1
上面数据,是我们模拟一次请求,用时44ms。可以看到,bucket分了11个,多了一个 5到最大值的buckets。 我们的数据从记录,在8个bucket中都记录了1次。
不同于传统直方图的特点:
1、桶是累积的,每个桶包含的值小于或等于桶上限阈值
上面示例中,44ms的样本数据,在8个buckets中都符合,所以50ms、100ms、250ms、500ms、1s、2.5s、5s、+Inf, 这8个桶都记录了1次。
所以每个桶都比之前的大,从左往右看,一定是非递减的额。
2、Prometheus直方图是时间序列
服务从exporter中每隔一段时间拉取指标,每次抓取的指标, 就是一个带有 “小于或等于”桶的累积直方图。
当我们要查询直方图数据时,实际是要处理直方图的时间序列。
3、时间序列本身是累积的
每个桶中的计数在指标的整个生命周期内是累积的,并且每个桶的值的变化(相较于上一次直方图)告诉我们自上次抓取以来观察值的分布变化。
Summary(摘要)
与 Histogram 类型类似,用于表示一段时间内的数据采样结果(通常是请求持续时间或响应大小等),但它直接存储了分位数(通过客户端计算,然后展示出来),而不是通过区间来计算。
Summary 类型的样本也会提供三种指标(假设指标名称为<basename>):
- 样本值得分位数分布情况,命名为 <basename>{quantile="<φ>"}
// 含义:这 12 次 http 请求中有 50% 的请求响应时间是 3.052404983s
io_namespace_http_requests_latency_seconds_summary{path="/",method="GET",code="200",quantile="0.5",} 3.052404983- 所有样本值得大小总和,命名为<basename>_sum。
// 含义:这12次 http 请求的总响应时间为 51.029495508s
io_namespace_http_requests_latency_seconds_summary_sum{path="/",method="GET",code="200",} 51.029495508- 样本总和,命名为 <basename>_count。
// 含义:当前一共发生了 12 次 http 请求
io_namespace_http_requests_latency_seconds_summary_count{path="/",method="GET",code="200",} 12.0
比较Histogram 与 Summary 的异同:
- 它们都包含了 <basename>_sum 和 <basename>_count 指标
- Histogram 需要通过 <basename>_bucket 来计算分位数,而Summary 则直接存储了分位数的值。
函数
rate、irate、increase
irate()
irate(v range-vector) 计算范围向量中时间序列的每秒瞬时增长率。是通过时间区间中最后两个样本数据来计算区间向量的增长速率,从而避免范围内的平均值拉低峰值的情况。
对于快速变化的计数器,适合用irate。如果用rate,因为使用了平均值,很容易把峰值削平,除非我们把时间间隔设置得足够小,能够减弱这种效应。
irate(v range-vector) calculates the per-second instant rate of increase of the time series in the range vector. This is based on the last two data points. Breaks in monotonity (such as counter resets due to target restarts) are automatically adjusted for.
irate should only be used when graphing volatile, fast-moving counters. Use rate for alerts and slow-moving counters, as brief changes in the rate can reset the FOR clause and graphs consisting entirely of rare spikes are hard to read.
Note that when combining irate() with an aggregation operator (e.g. sum()) or a function aggregating over time (any function ending in _over_time), always take a irate() first, then aggregate. Otherwise rate() cannot detect counter resets when your target restarts.
rate()
rate(v range-vector) 计算范围向量中时间序列得每秒平均增长率。单调性终端(例如由于目标重启导致得计数器重置)会自动进行调整。同样,计算会外推到时间范围的末尾,能允许一些数据丢失和不完美的数据对齐。
rate只能用于counters类型数据。适合用于对缓慢变化的counter类型数据进行告警和画图展示。
注意,如果要用于聚合操作,比如sum等,要先用rate函数再用聚合函数。否则,rate不能检测到counter类型数据的重置。
rate(v range-vector) calculates the per-second average rate of increase of the time series in the range vector. Breaks in monotonicity (such as counter resets due to target restarts) are automatically adjusted for. Also, the calculation extrapolates to the ends of the time range, allowing for missed scrapes or imperfect alignment of scrape cycles with the range's time period.
rate should only be used with counters. It is best suited for alerting, and for graphing of slow-moving counters.
Note that when combining rate() with an aggregation operator (e.g. sum()) or a function aggregating over time (any function ending in _over_time), always take a rate() first, then aggregate. Otherwise rate() cannot detect counter resets when you target restarts.
increase()
此函数和rate()完全一样,只是它没有将最终单位转换为"每秒"。 每个规定的采样周期就是它的最终单位。
例如:increase(http_requests_total[5m]) 得出的是5分钟的采样周期内处理完成的HTTP请求的总增长量(单位1/5m)。因此increase(foo[5m])/ (5 * 60) 等同于rate(foo[5m])。
对比
这三个函数都有一个共同的要求,就是它们在规定的采样周期中都需要有至少两个样本才能运行。少于两个样本的序列将从结果中删除。
数据外推
rate() 和 increase() 两个函数有外推的逻辑, irate() 只看两个样本间每秒的增长,所以它不做这种外推。
当我们写一个PromQL,我们基于区间向量http_request_count,写好了一个区间向量过滤器,时间选择器用5m。比如 increase(http_request_count[5m]) 或者 rate(http_request_count[5m]) 。
在一个时间窗口(5m)内,假如正好就有两个样本,这两个样本不可能正好与规定时间窗口的开始和结束100%重合。那么对于increase、rate,它们会在窗口与窗口的界限中外推第一个和最后一个数据点之间的斜率,以得出一个平均而言更接近整个窗口内预期增长的数值。
下图是一个例子,使用rate()函数,窗口时间 1分钟,采样间隔15s,在窗口中发生了一次counter实际增加1的情况。
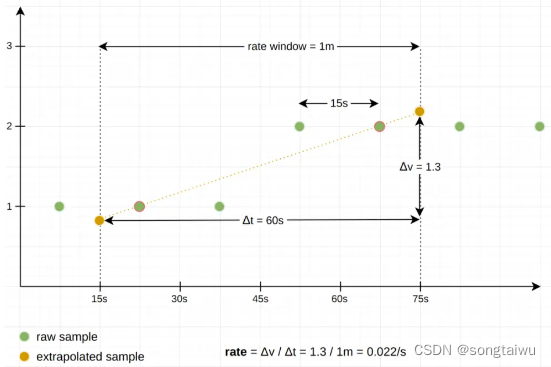
如上图所示,结果是0.022/s, 这是基于窗口中第一个和最后一个样本之间的斜率产生的,并外推到窗口边界处。
存储
Prometheus 采用自定义的存储格式将样本数据保存在本地磁盘当中
存储格式
Prometheus 按照两个小时为一个时间窗口,将两个小时内产生的数据存储在一个块(Block)中。每个块都是一个单独的目录,里面含该时间窗口内的所有样本数据(chunks), 元数据文件(meta.json)以及索引文件(index)。其中索引文件会将指标名称和标签索引到样板数据的时间序列中。此期间如果通过API删除时间序列,删除记录会保存在单独的逻辑文件 tombstone当中。
当前样本数据所在的块会被直接保存在内存中,不会持久化到磁盘中。为了确保Prometheus 发生崩溃或重启时能够恢复数据,Prometheus 启动时会通过预写日志(write-ahead-log (WAL))重新记录,从而恢复数据。 预写日志文件保存在 wal 目录中,每个文件大小为 128MB。


 被折叠的 条评论
为什么被折叠?
被折叠的 条评论
为什么被折叠?
 到【灌水乐园】发言


